ECON 366: Energy Economics
Topic 2.4: Oil and Gas Project Valuation
Andrew Leach, Professor of Economics and Law
Net Present Value and other project finance metrics
Recall the idea of a net present value of a stream of profits \(\Pi_t\) for \(n\) time periods indexed by \(t\): $$NPV=\sum_{t=1}^n \frac{1}{(1+r)^t}\Pi_t$$
This concept forms the basis of a number of important measures used to evaluate projects:
- \(NPV_k\), the net present value at a k% rate of discount e.g. \(NPV_{10}\)
- payback is the number of periods \(n\) it takes for \(NPV_0\) to be positive (i.e \(r=0\))
- discounted payback is the number of periods \(n\) it takes for \(NPV_k>0\) for \(k>0\)
- (i.e for some \(r>0\), usually 10%)
- internal rate of return (IRR) is the rate \(k\) such that \(NPV_k\) = 0
- supply cost or break even oil price is the price at which \(NPV_k=0\), usually reported for \(NPV_{10}=0\)
Net Present Value and other project finance metrics
Recall the idea of a net present value of a stream of profits \(\Pi_t\) for \(n\) time periods indexed by \(t\): $$NPV=\sum_{t=1}^n \frac{1}{(1+r)^t}\Pi_t$$
Why might an oil company use payback or *discounted payback as a metric?
Does break even mean what you think it means?
Which metric would you prefer?
Net Present Value and other project finance metrics
Recall the idea of a net present value of a stream of profits \(\Pi_t\) for \(n\) time periods indexed by \(t\): $$NPV=\sum_{t=1}^n \frac{1}{(1+r)^t}\Pi_t$$
This deck looks at the last modification to that formula: the supply cost for an oil project.
- supply cost or break even oil price is the price at which \(NPV_k=0\), usually reported for \(NPV_{10}=0\)
Supply Cost
Let \(p\) be the price of oil
- \(p\) is usually a benchmark, WTI or Brent
- \(p\) could also be implied plant-gate bitumen prices, for example
Now, allow the stream of profits to be a function of prices \(p\) for each time t, denoted by \(\Pi_t(p_t)\), and let the supply cost be given by: $$\text{Supply cost}=\{\bar{p_t}\}^n_{t=1} \ni \sum_{t=1}^n \frac{1}{(1+r)^t}\Pi_t(\bar{p_t})=0$$ i.e. \(\{\bar{p_t}\}^n_{t=1}\) is the set of constant real (or, increasing nominal) oil prices chosen such that the net present value of the project is zero, usually for \(r=10%\) or \(r=12%\)
Oil Sands Project Economics
What does an oil sands investment involve?
- Purchase a lease
- Seek regulatory approval
- Build an extraction facility
- Burn diesel and/or natural gas
- Use chemicals
- Produce bitumen
- Purchase diluent
- Ship and sell diluted bitumen
- Reclaim/remediate land and tailings
Oil Sands Project Economics
What does an oil sands investment involve for our purposes today?
- Build an extraction facility
- Burn diesel and/or natural gas
- Use chemicals
- Produce bitumen
- Purchase diluent
- Ship and sell diluted bitumen
A simplified version of the problem
The basic approach to a financial model
What do I need to know to assess the NPV (or other metrics) for this project?
- Construction costs and schedules
- Operating and maintenance costs
- Output
- Prices
- Fiscal regimes (taxes and royalties)
- Financing
Initially, let’s worry about the big ones
- Prices
- Output
- Capital, operating and maintenance
What am I selling?
- Oilsands projects produce bitumen (not a homogeneous commodity, but we’ll treat it as such for today)
- In order to be transported by pipeline, bitumen must be diluted
- Diluted bitumen trades roughly on par with heavy oil
- Heavy oil trades at a discount to light oil due to its lower value to refiners
Recall this graph of oil sands pricing?
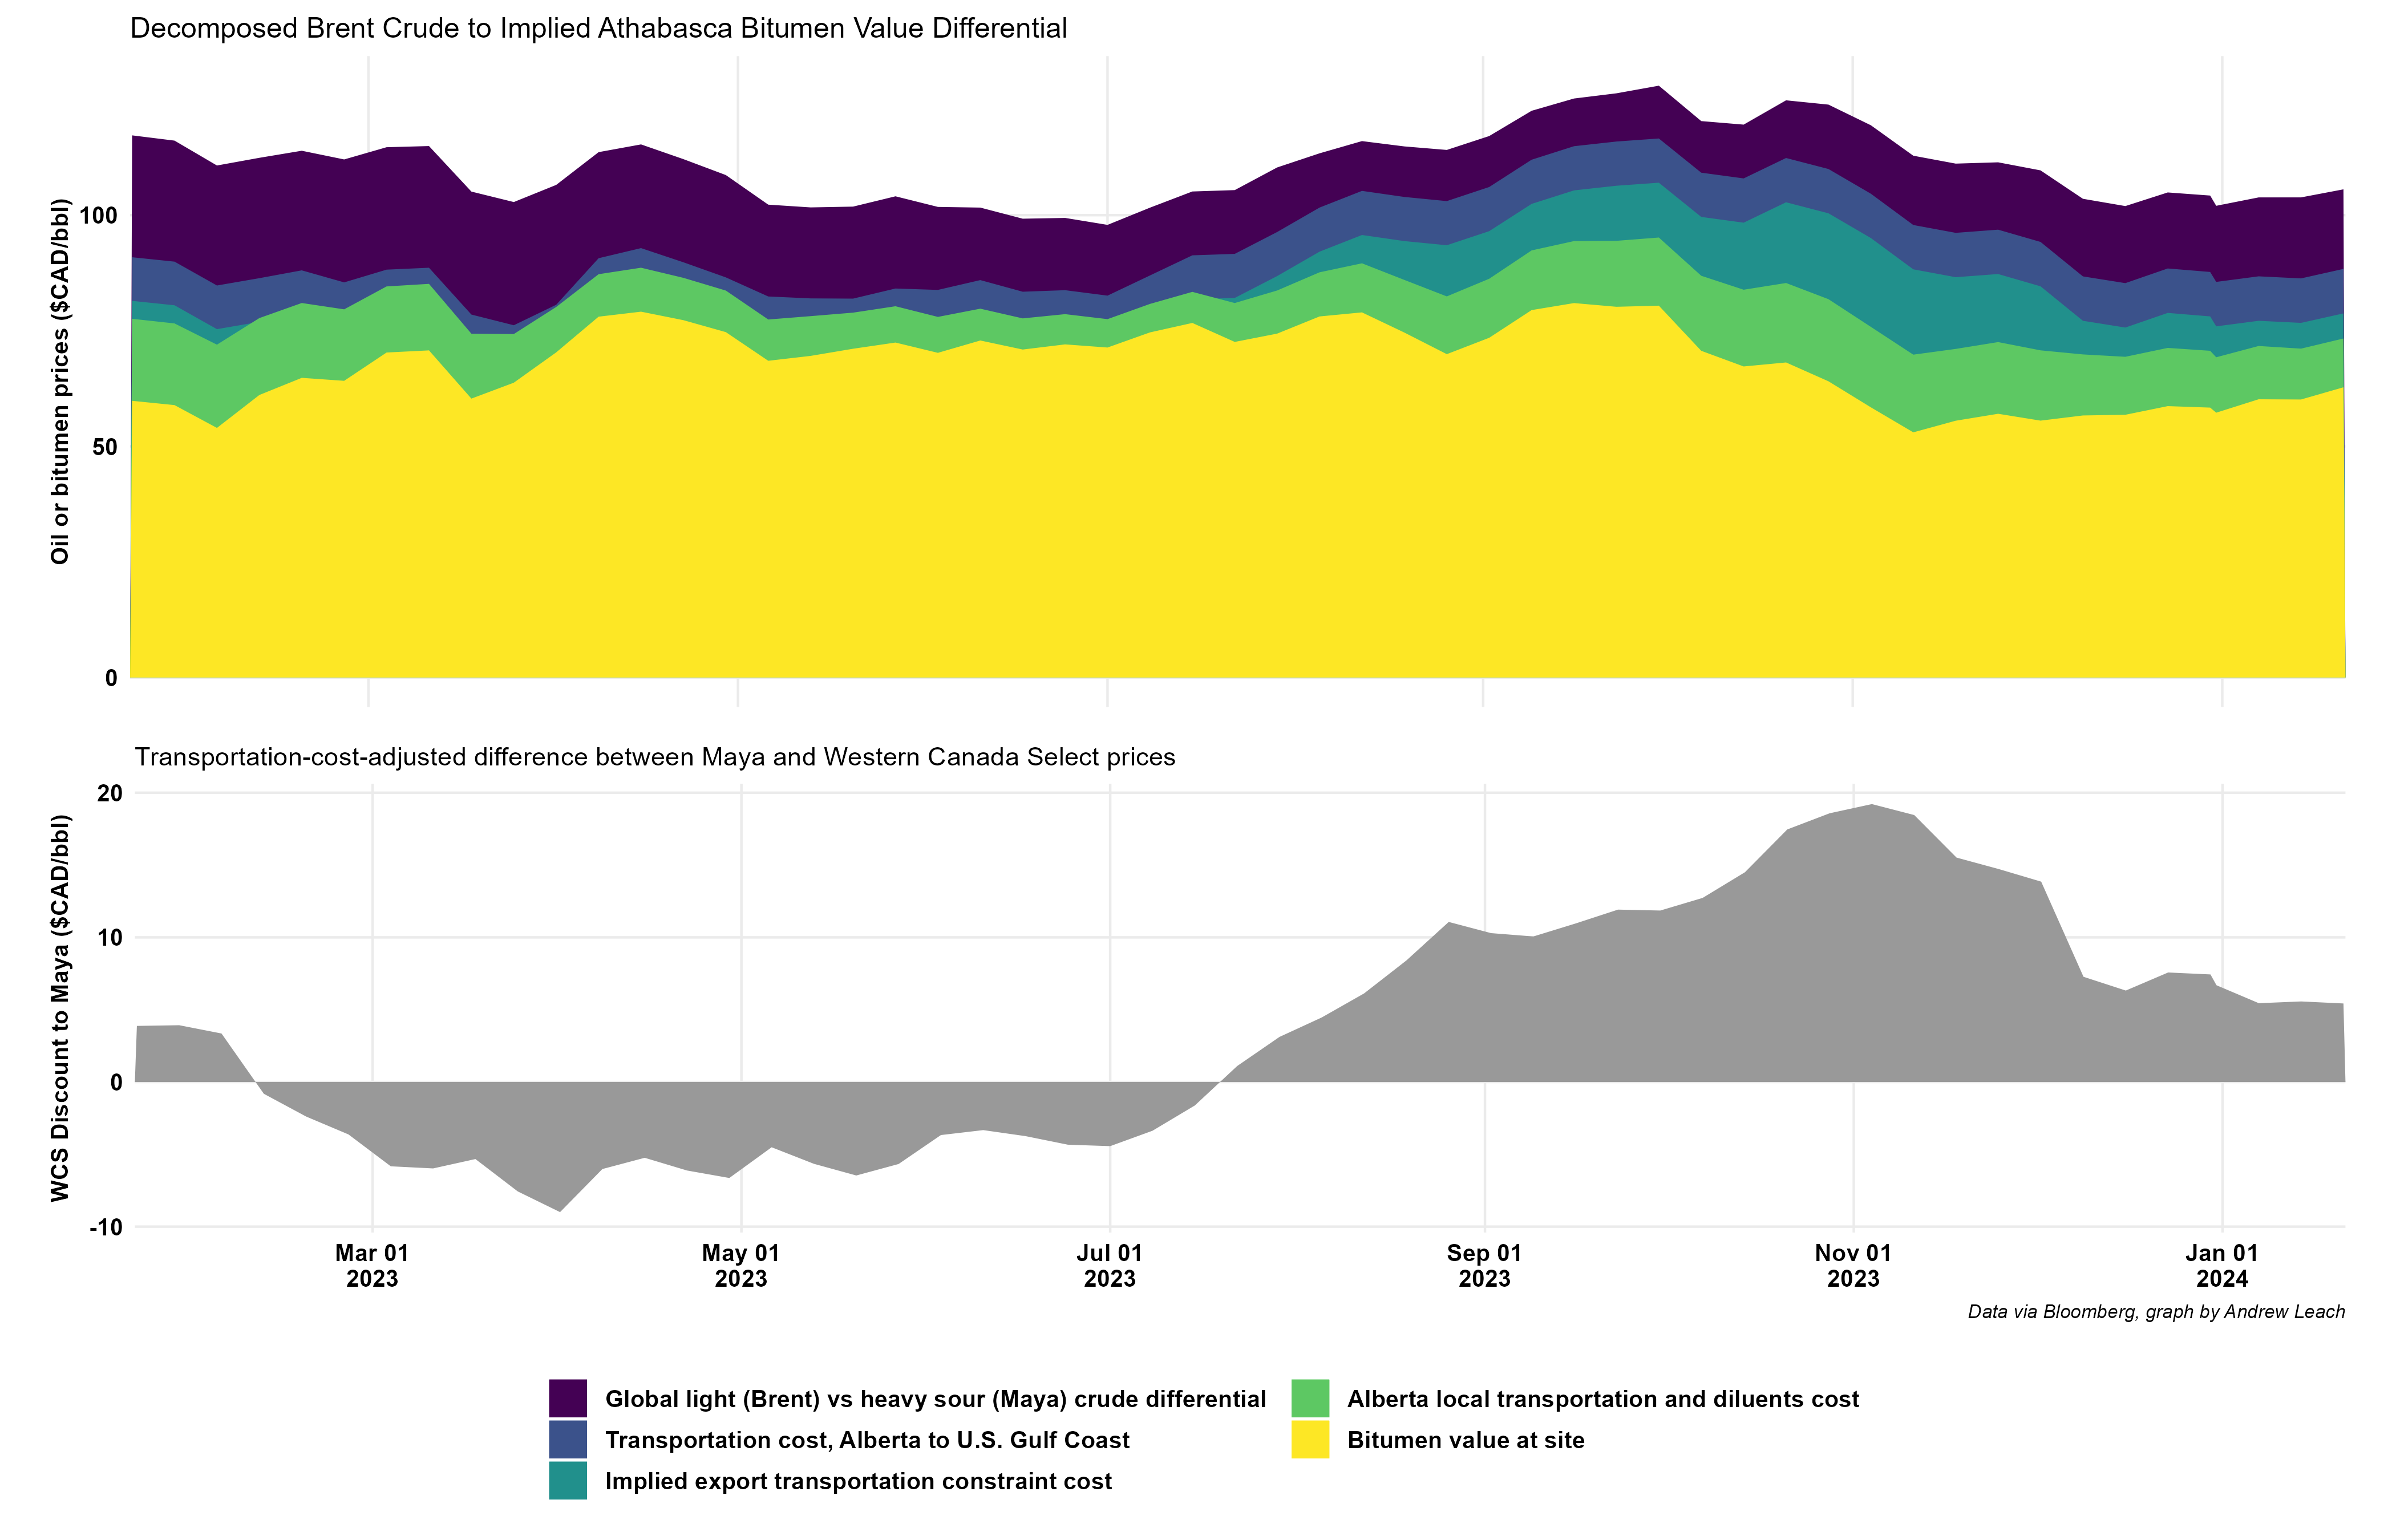
Now we need to solve for the top of the yellow: the implied value of bitumen at the plant gate
Derived value of bitumen
How much is a barrel of bitumen worth?
- Start with the price of a barrel of WCS at Hardisty – $US 56, or $CA 75 per barrel
- Now, what do I need to do to get bitumen from my site to Hardisty in WCS-form?
- A barrel of WCS is (approximately) 30% diluent, 70% bitumen
- I need to purchase .3 barrels of diluent at Hardisty, for a price of $110/bbl, or $33 diluent cost
- I need to ship that to my site, at a cost of $1/bbl, or $0.30 total cost
- I need to ship one barrel of WCS-equivalent to Hardisty, at a cost of $1.50
- My net revenue from the sale of a barrel of WCS equivalent is (75-33-0.30-1.50)=40.20 What's the implied value of a barrel of bitumen at site?
$$\frac{\$75-\$33-\$0.30-\$1.50}{0.7\text{ bbl bitumen}}=\frac{\$40.20}{0.7 \text{ bbl bitumen}}=\frac{\$57.43}{\text{bbl bitumen}}$$
Pricing in the model template
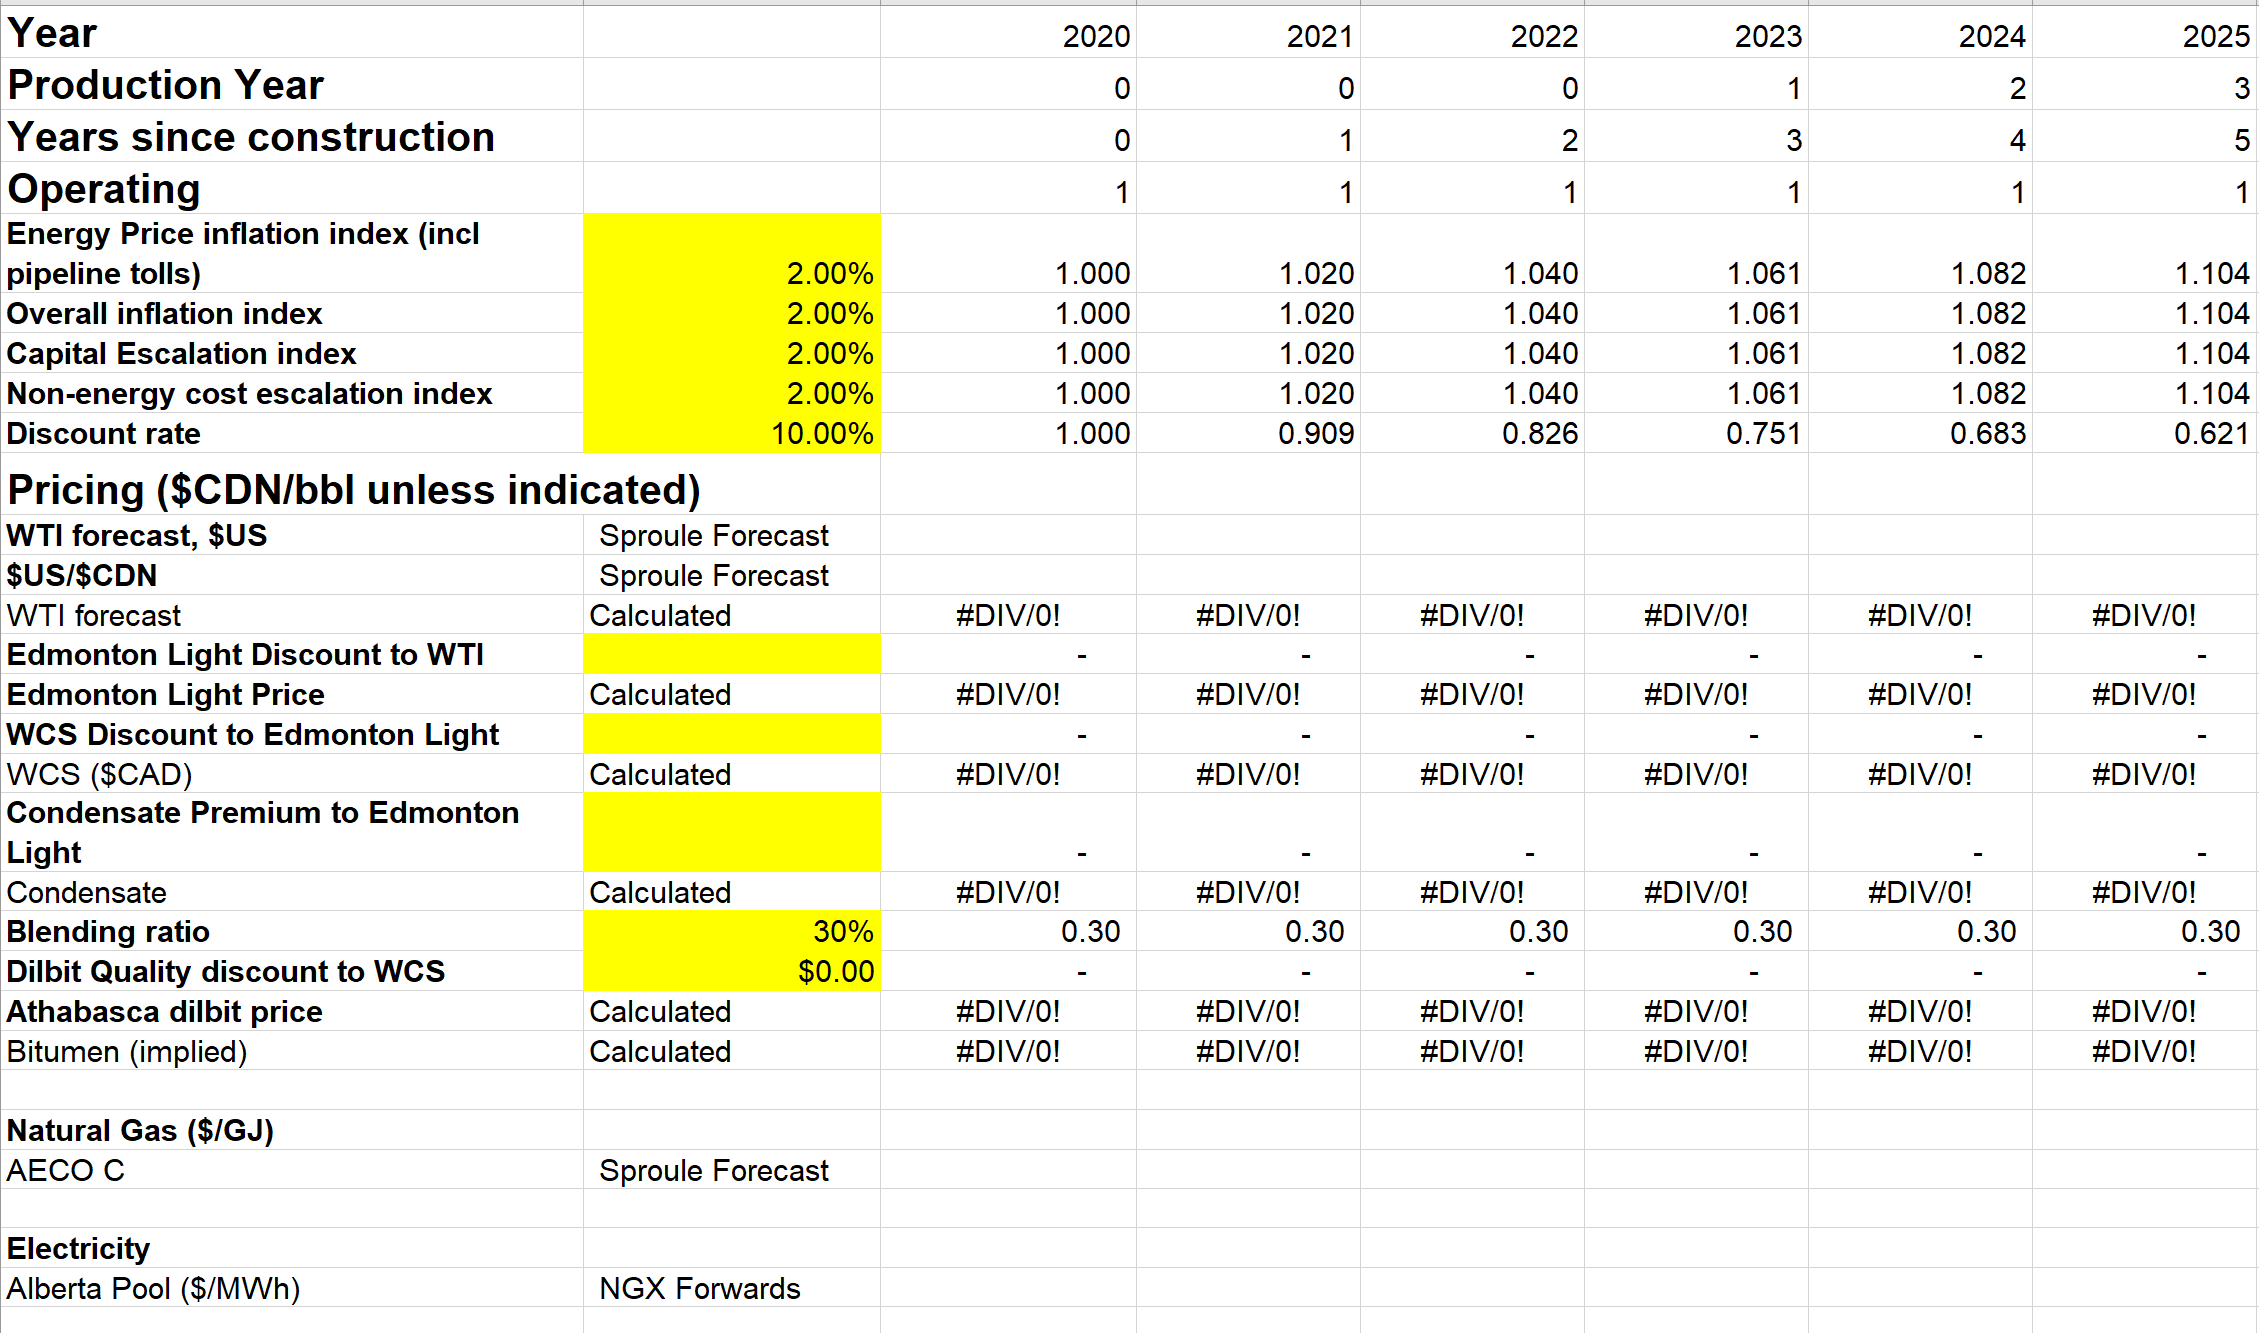
Sproule Prices
Production
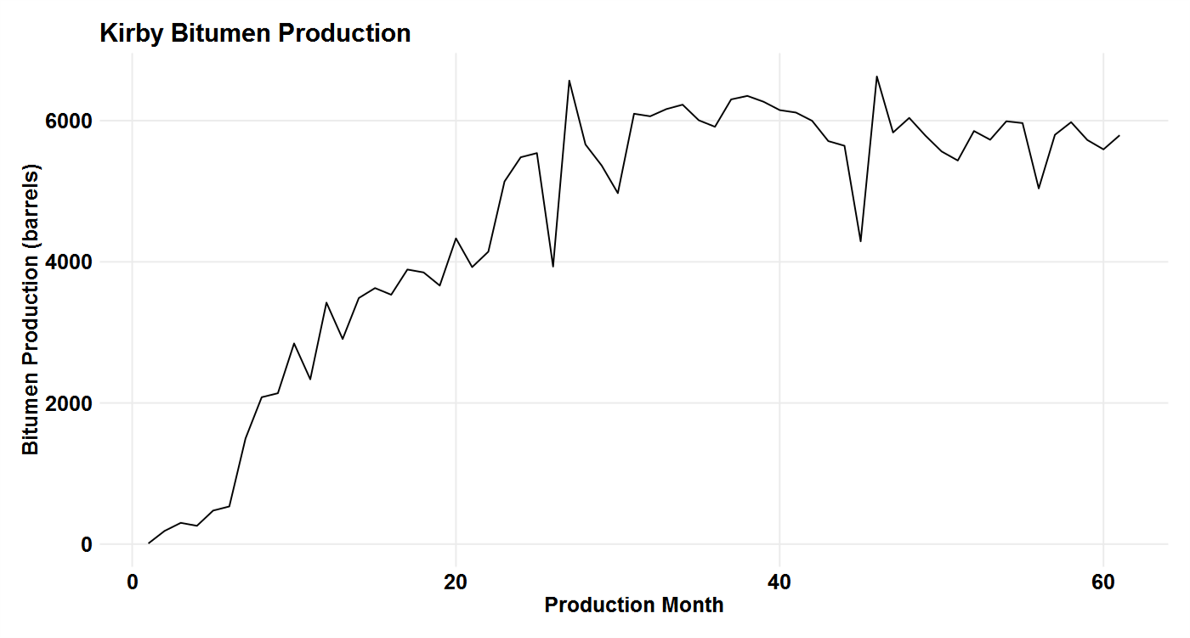
- Production timelines will vary by facility, resource type, production technology, etc.
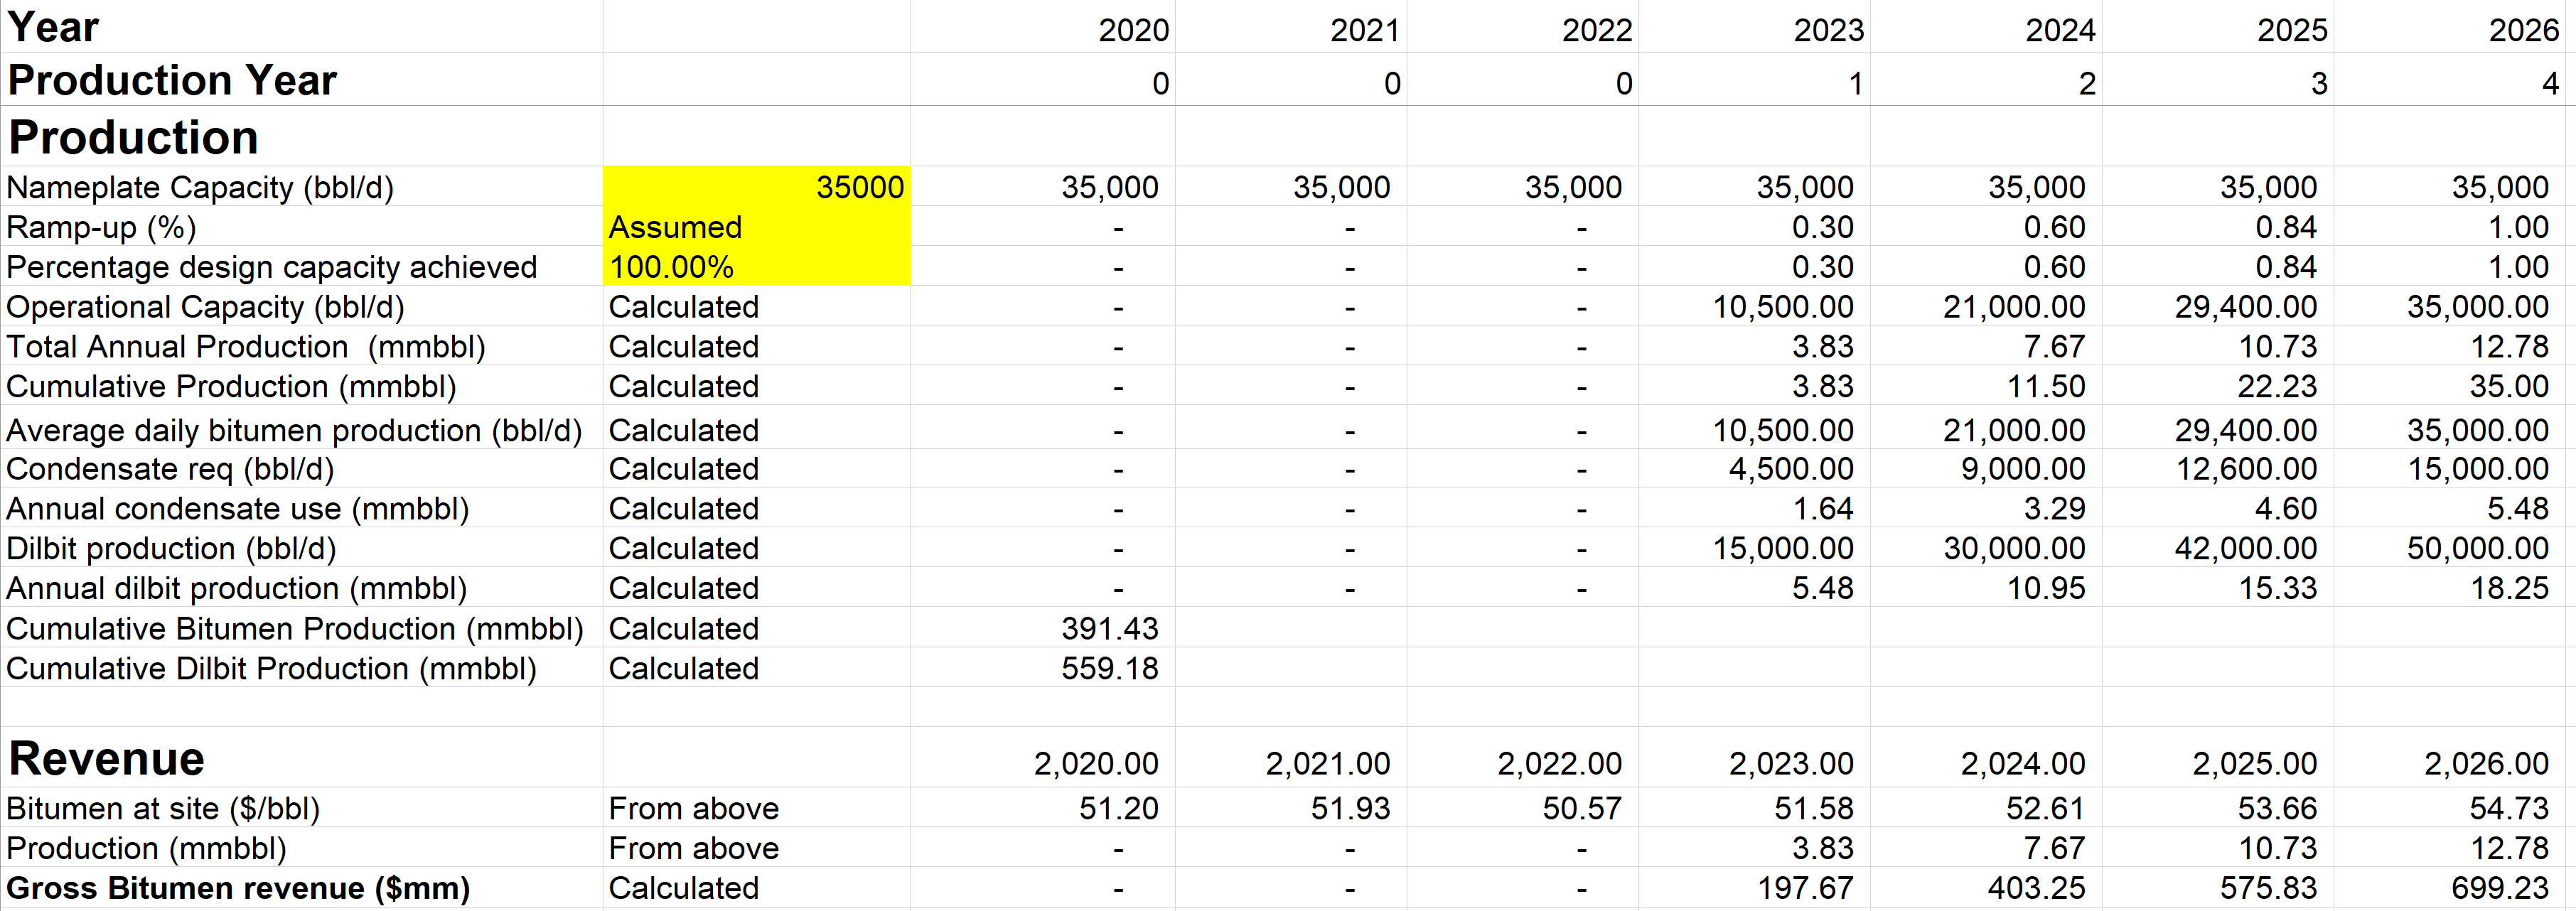
- Production drives the revenue side of your cash flow model
- Oil sands facilities tend to have a long ramp-up (3-4 years for mines, 1-2 years for in-situ) followed by stable production at or close to nameplate capacity for 25-50 years depending on the facility
Production
Production and revenue in the model template
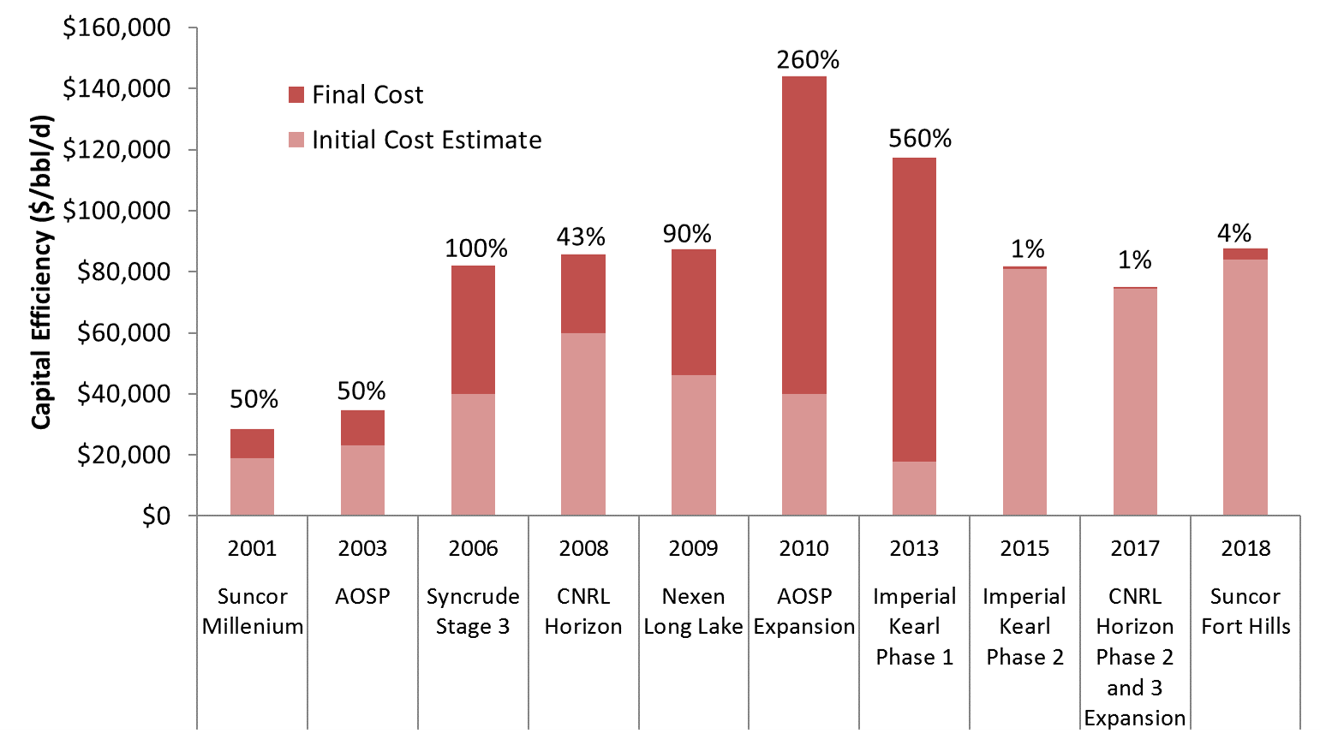
Initial capital and construction costs (including land)
Expressed in cost per flowing barrel:
$$\frac{\text{Project capital up-front capital cost (dollars)}}{\text{Project daily production capacity (barrels per day)}}$$
For example: Firebag 4 total cost was $1.7 billion for 42,500 b/d of capacity = $40,000 per flowing barrel
Think of the oil production from a facility as an annuity, and the cost per flowing barrel as the up-front payment to access that annuity for a term equal to the project life.
Capital cost inflation was once a major risk
Project operating costs and fiscal policies
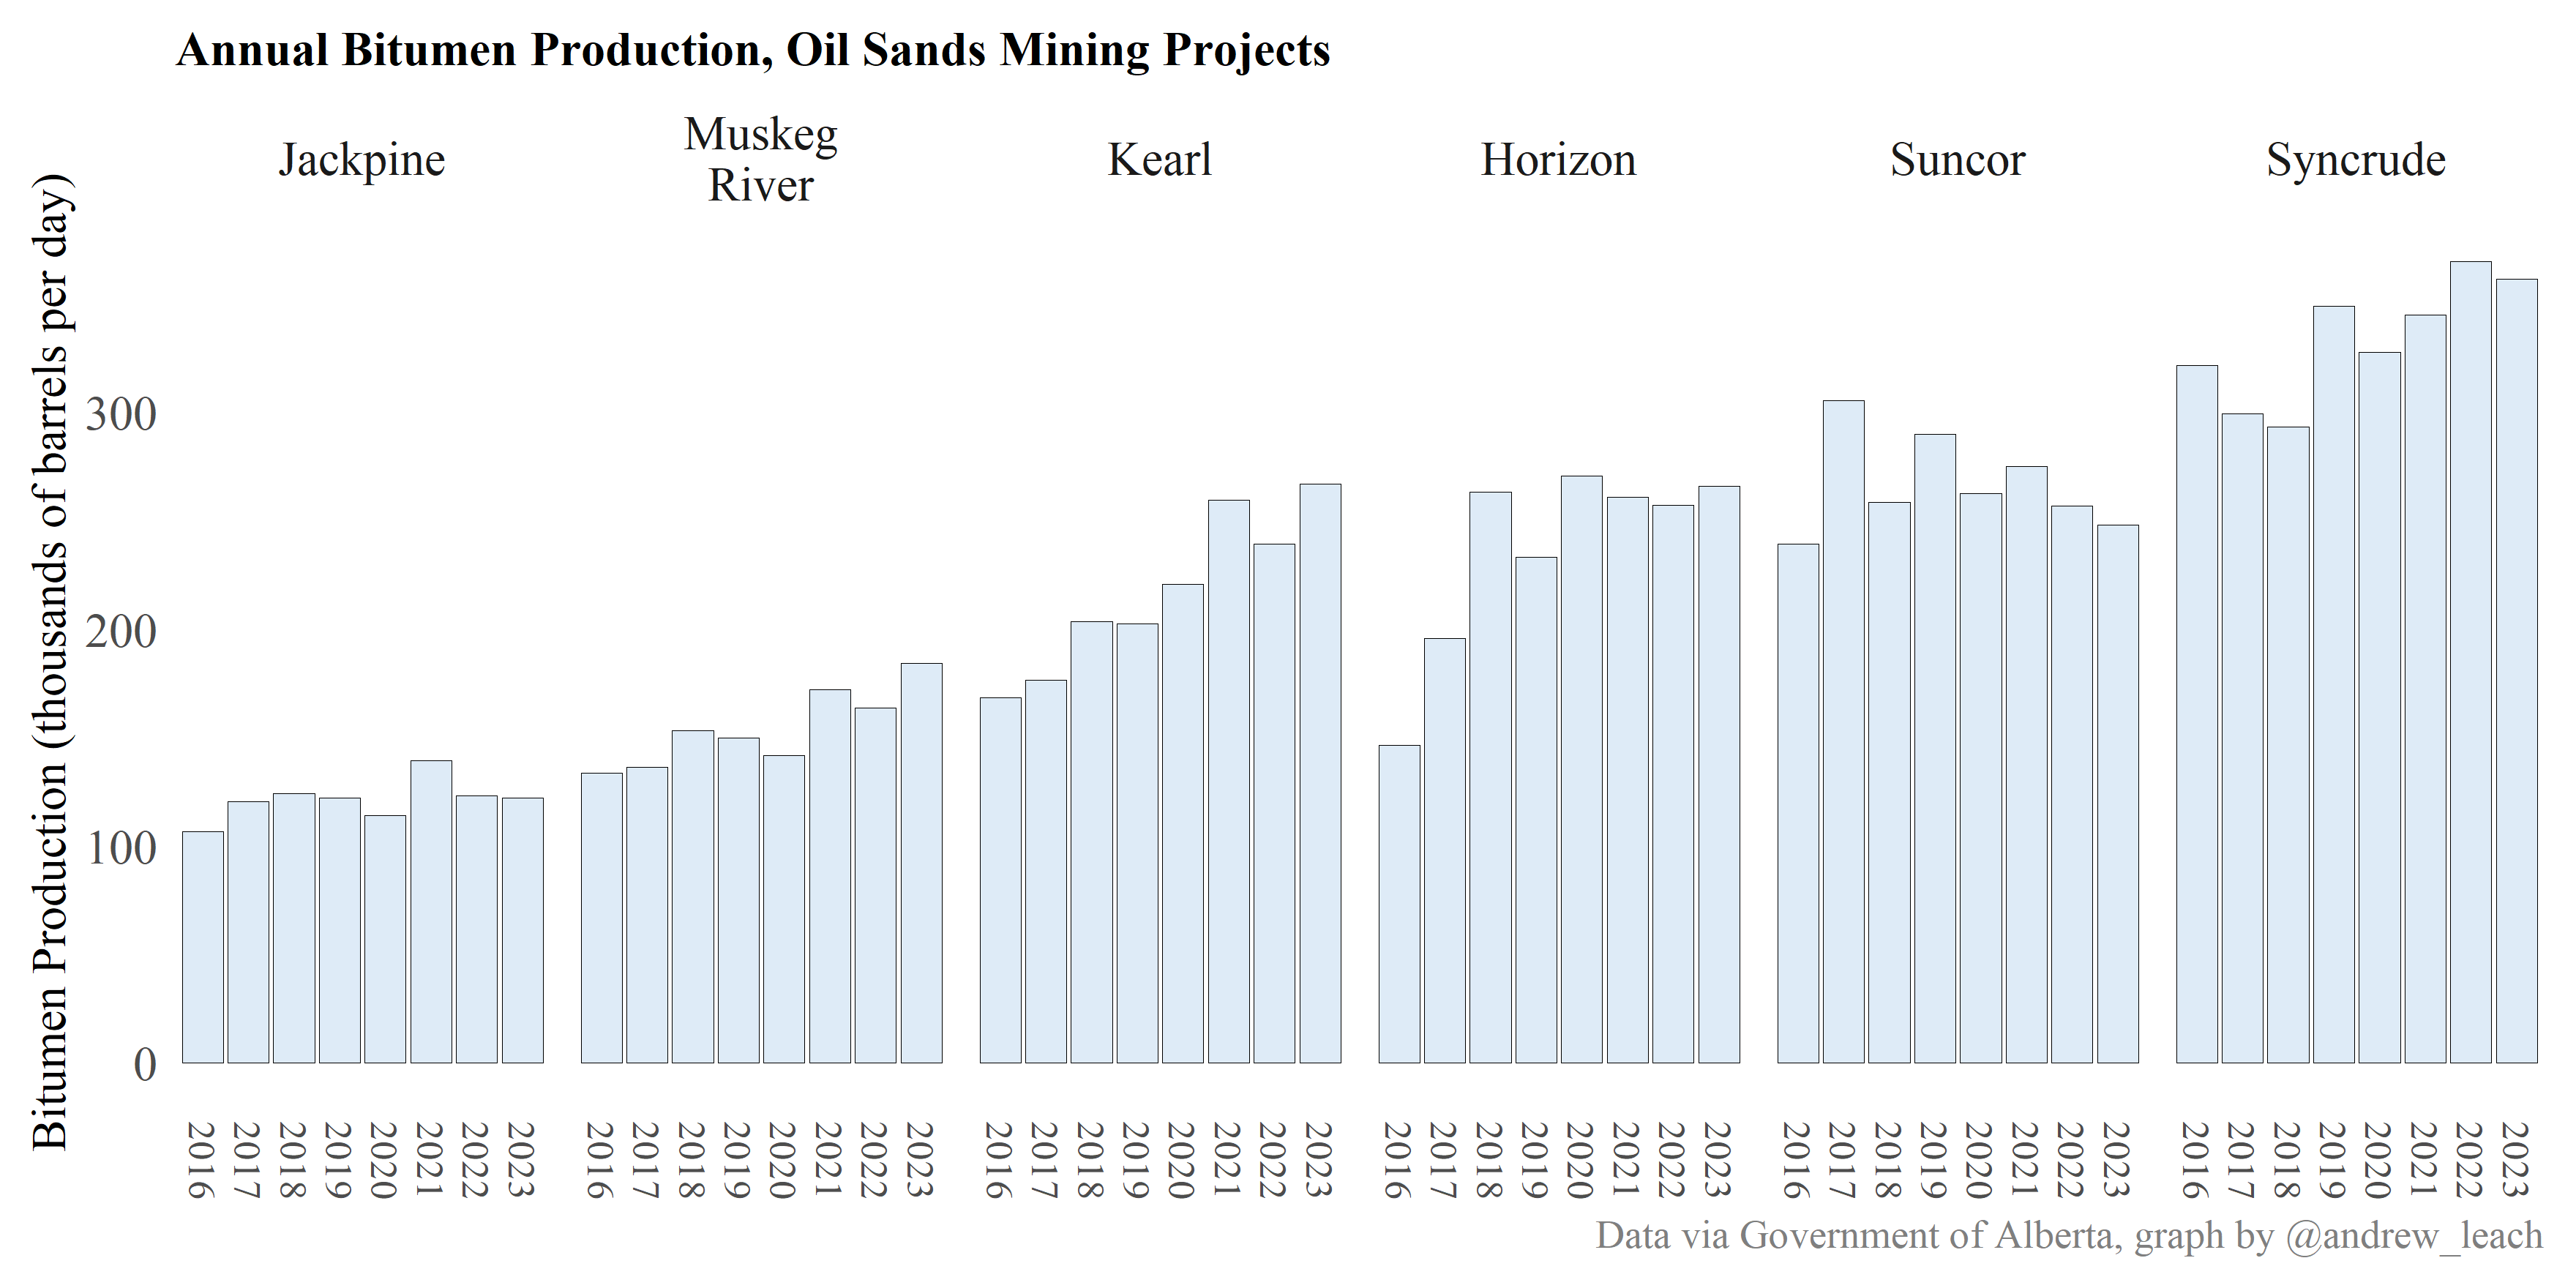
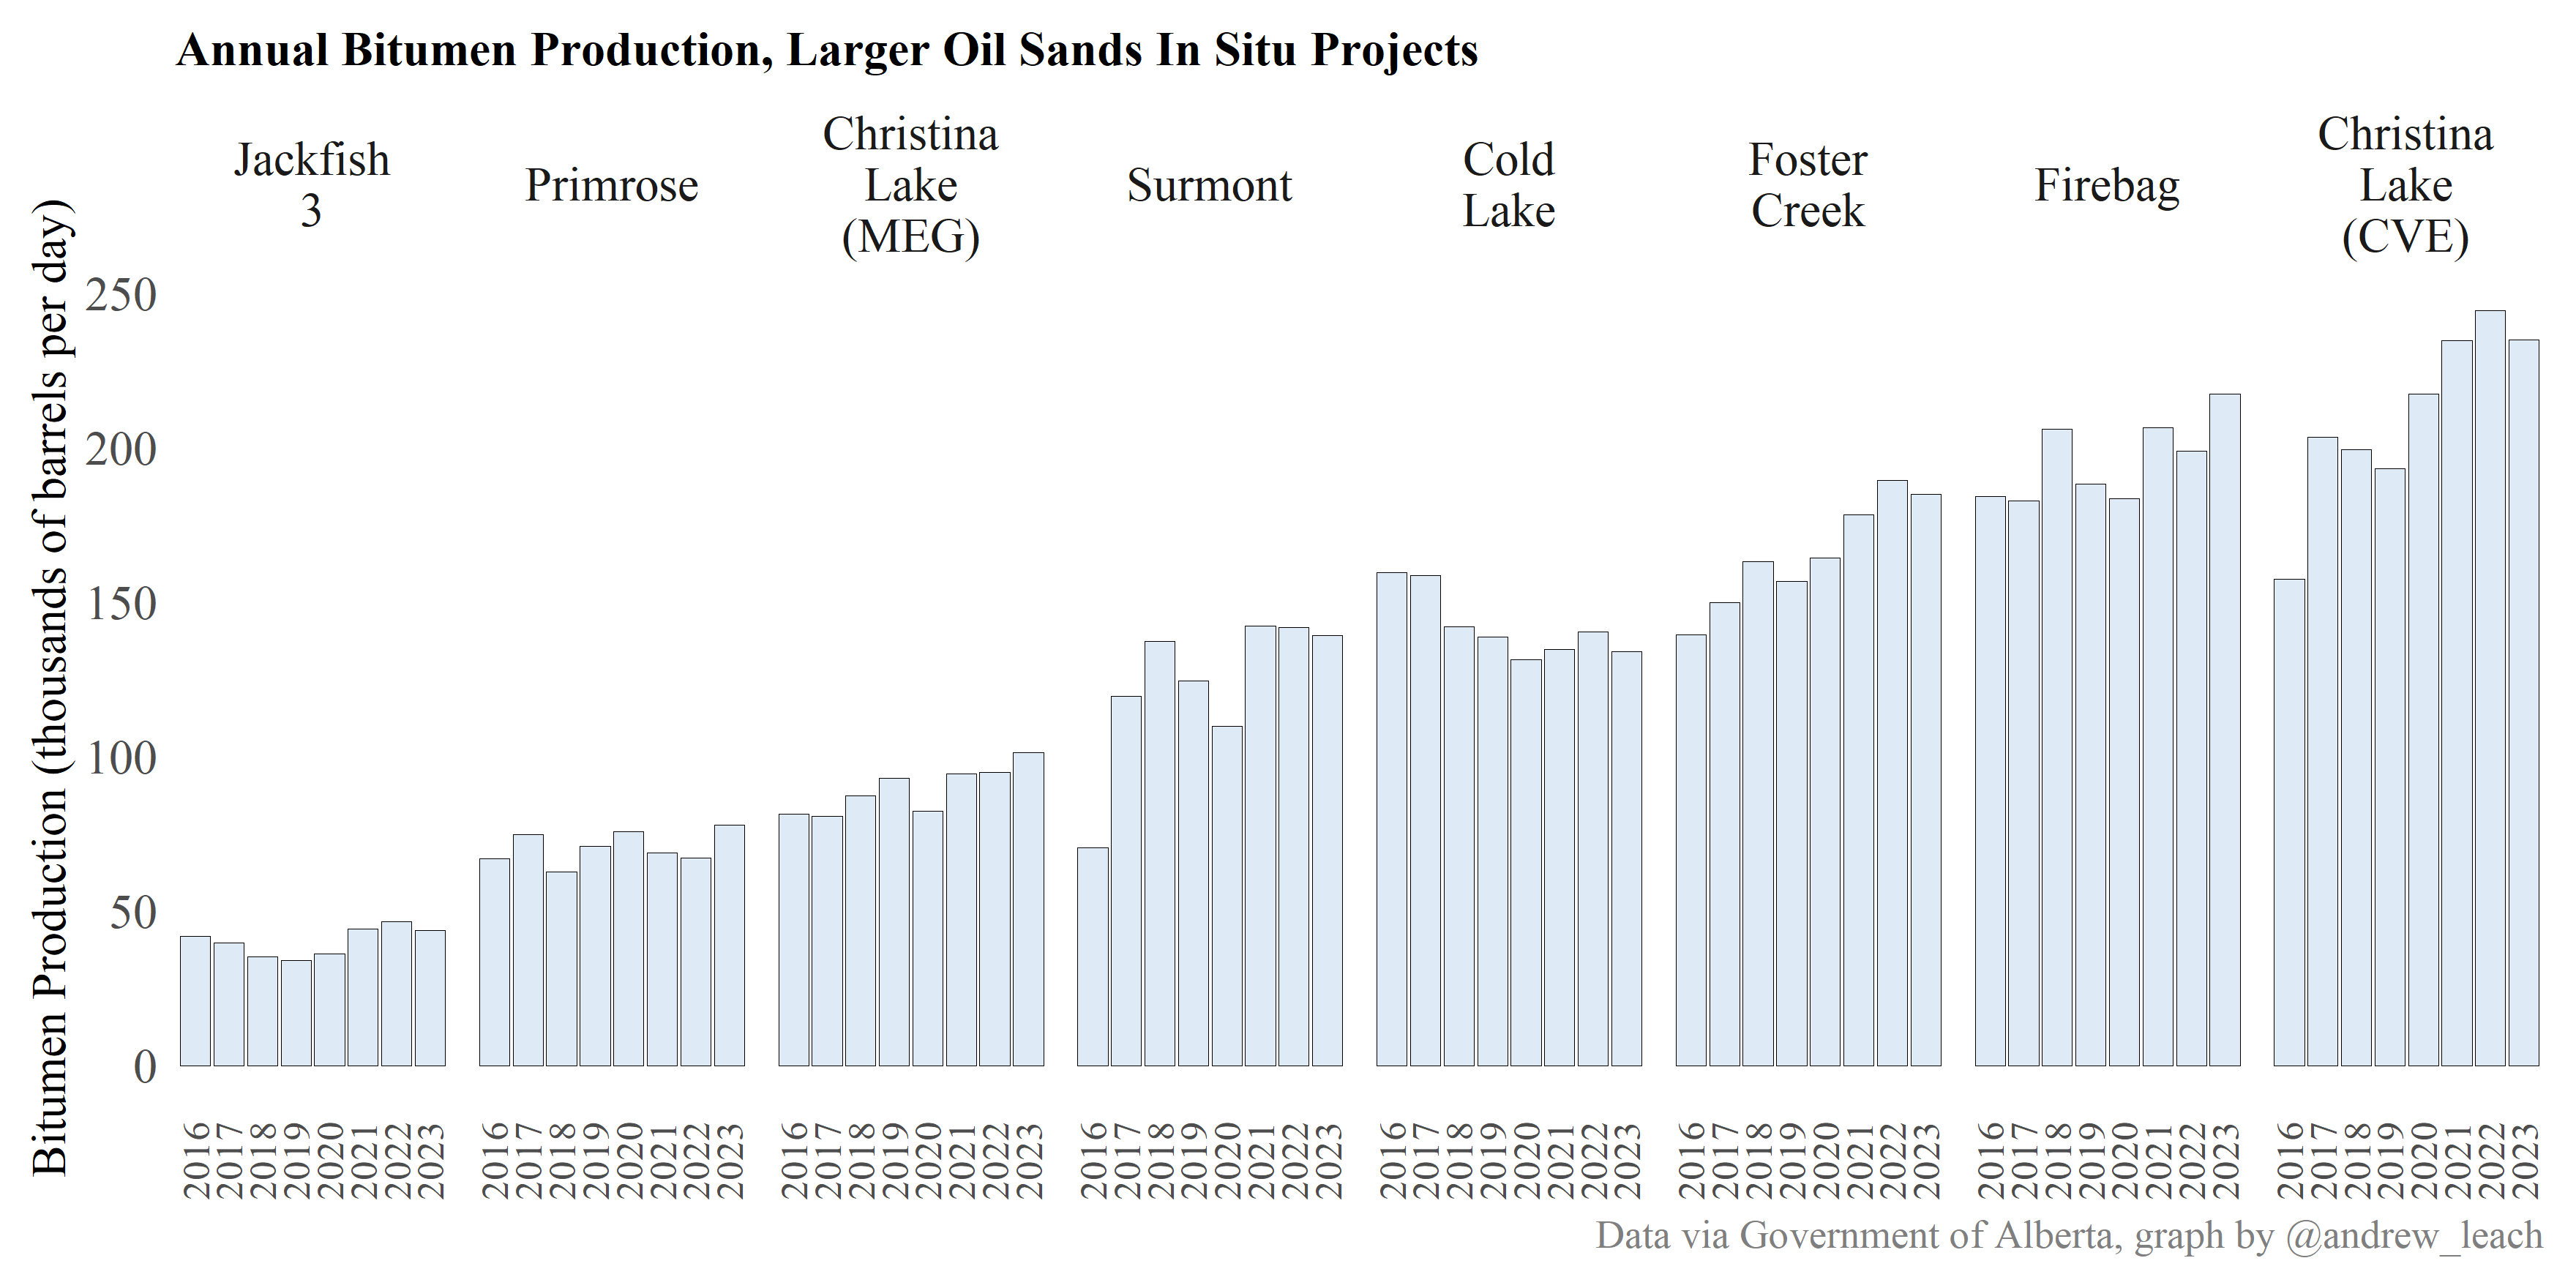
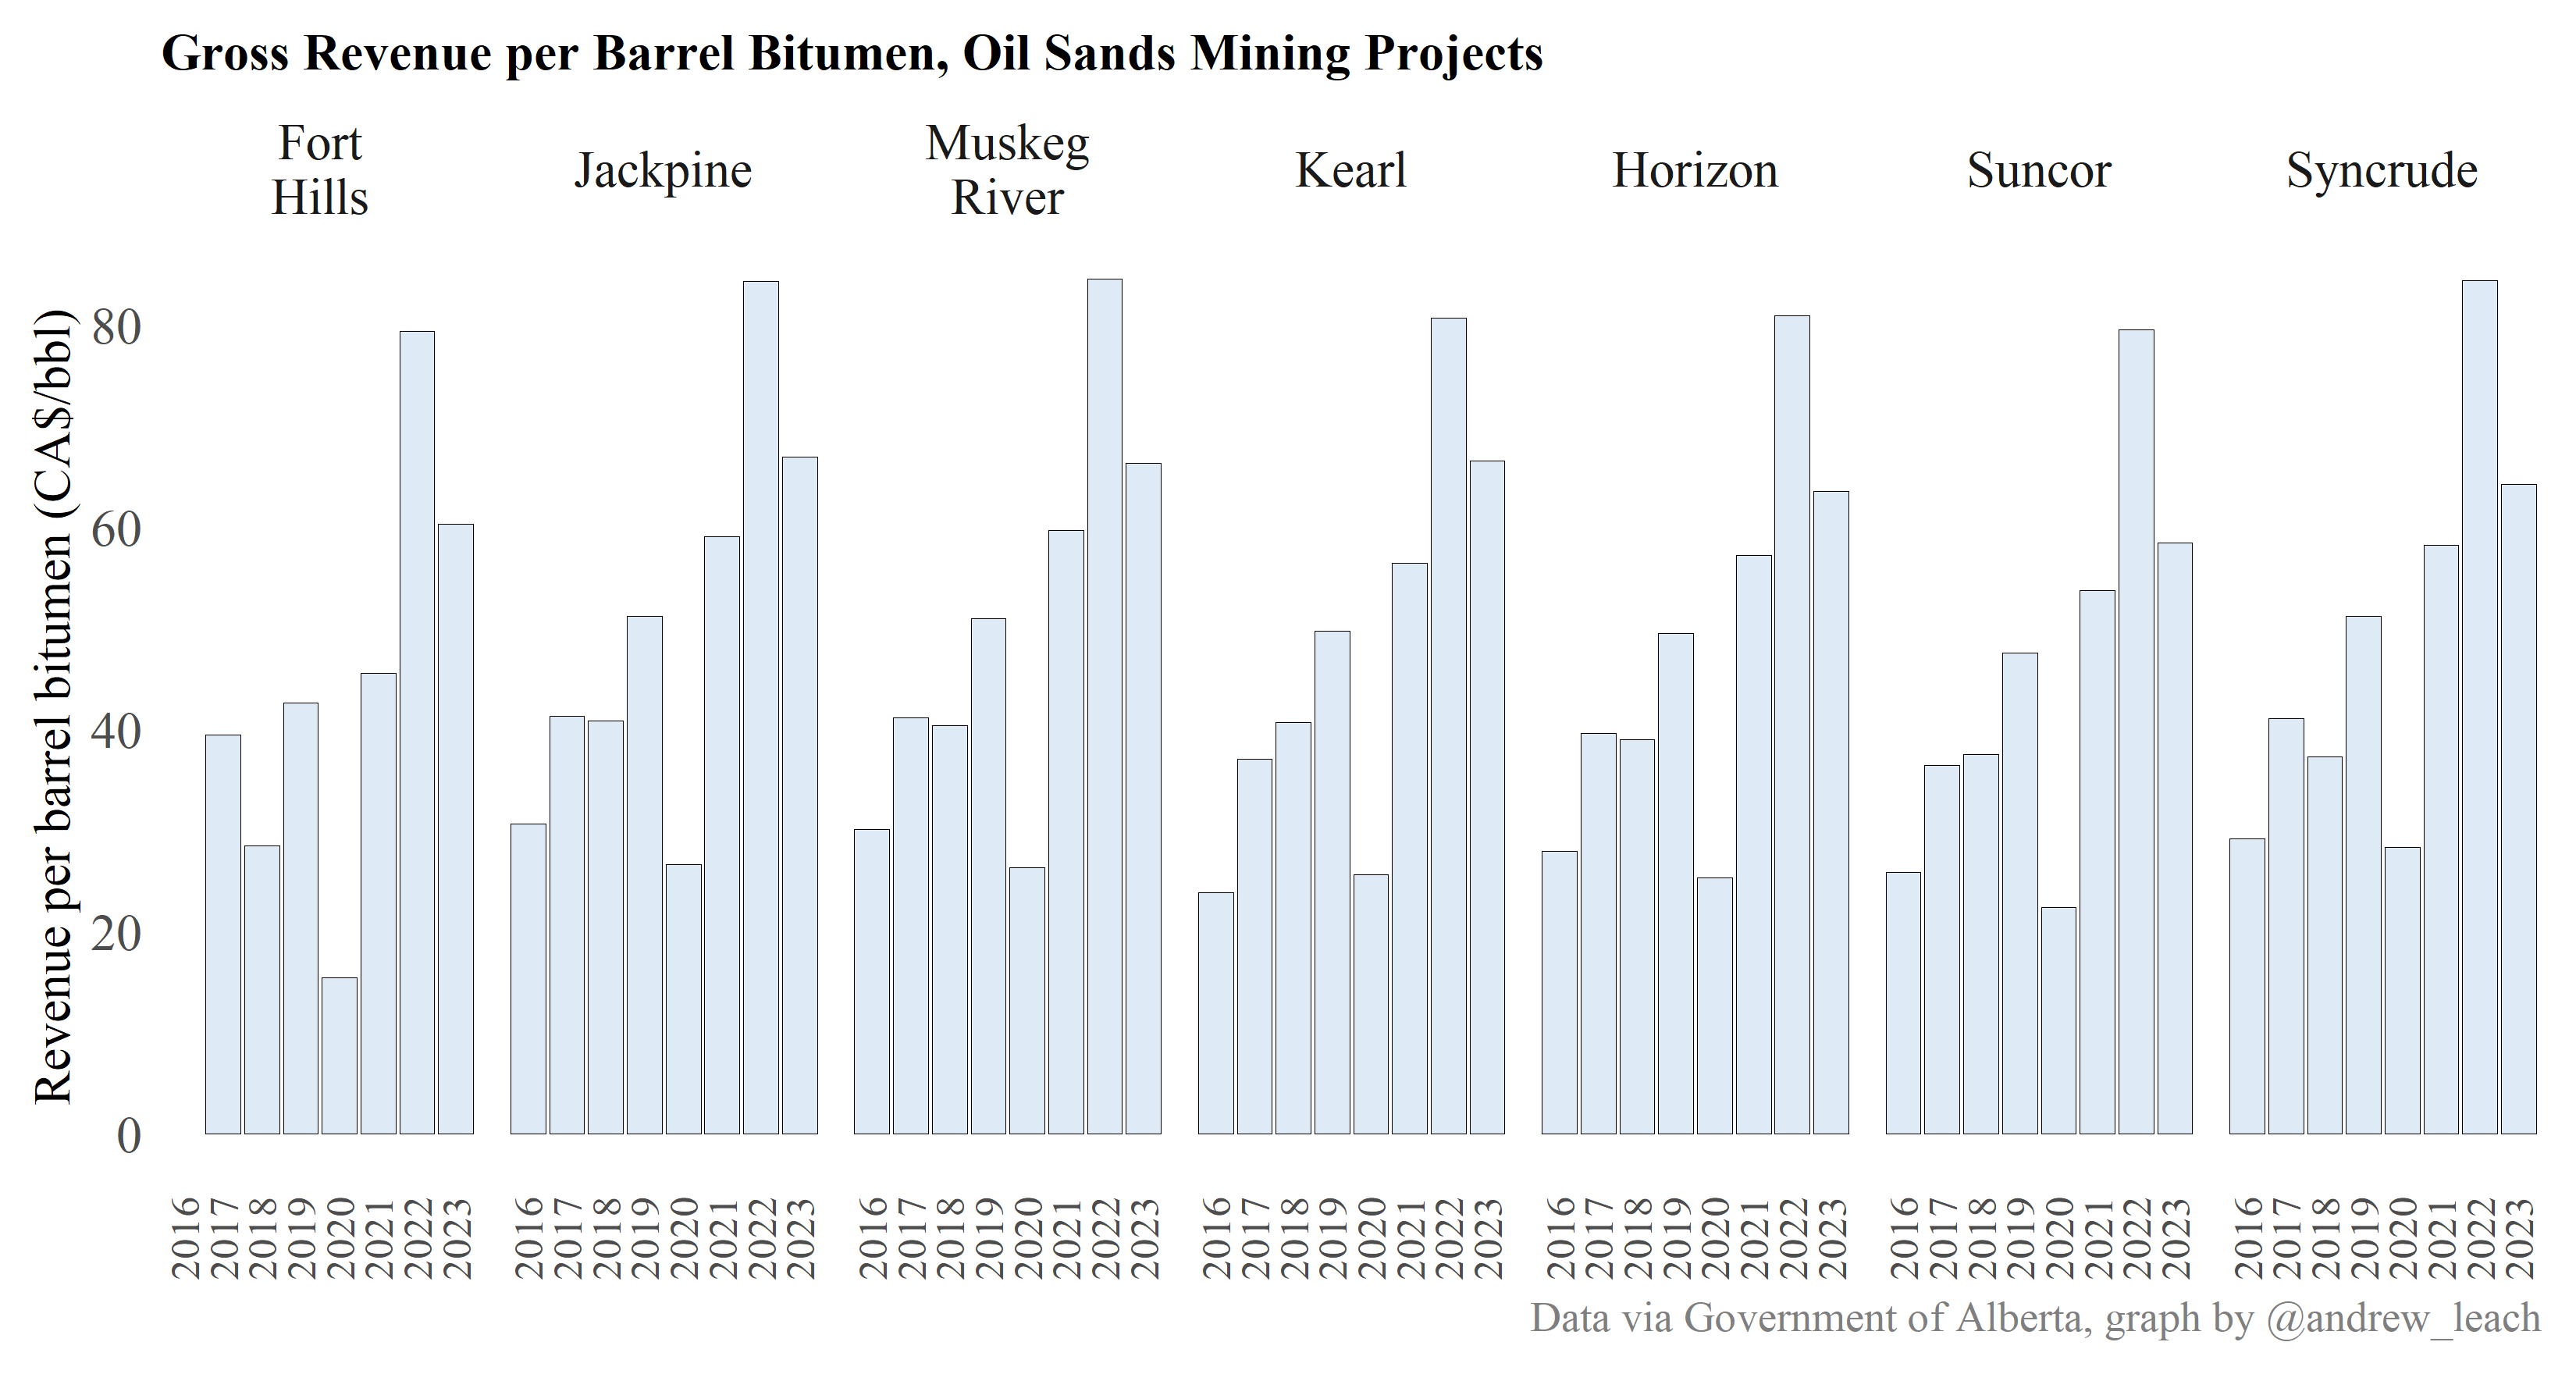
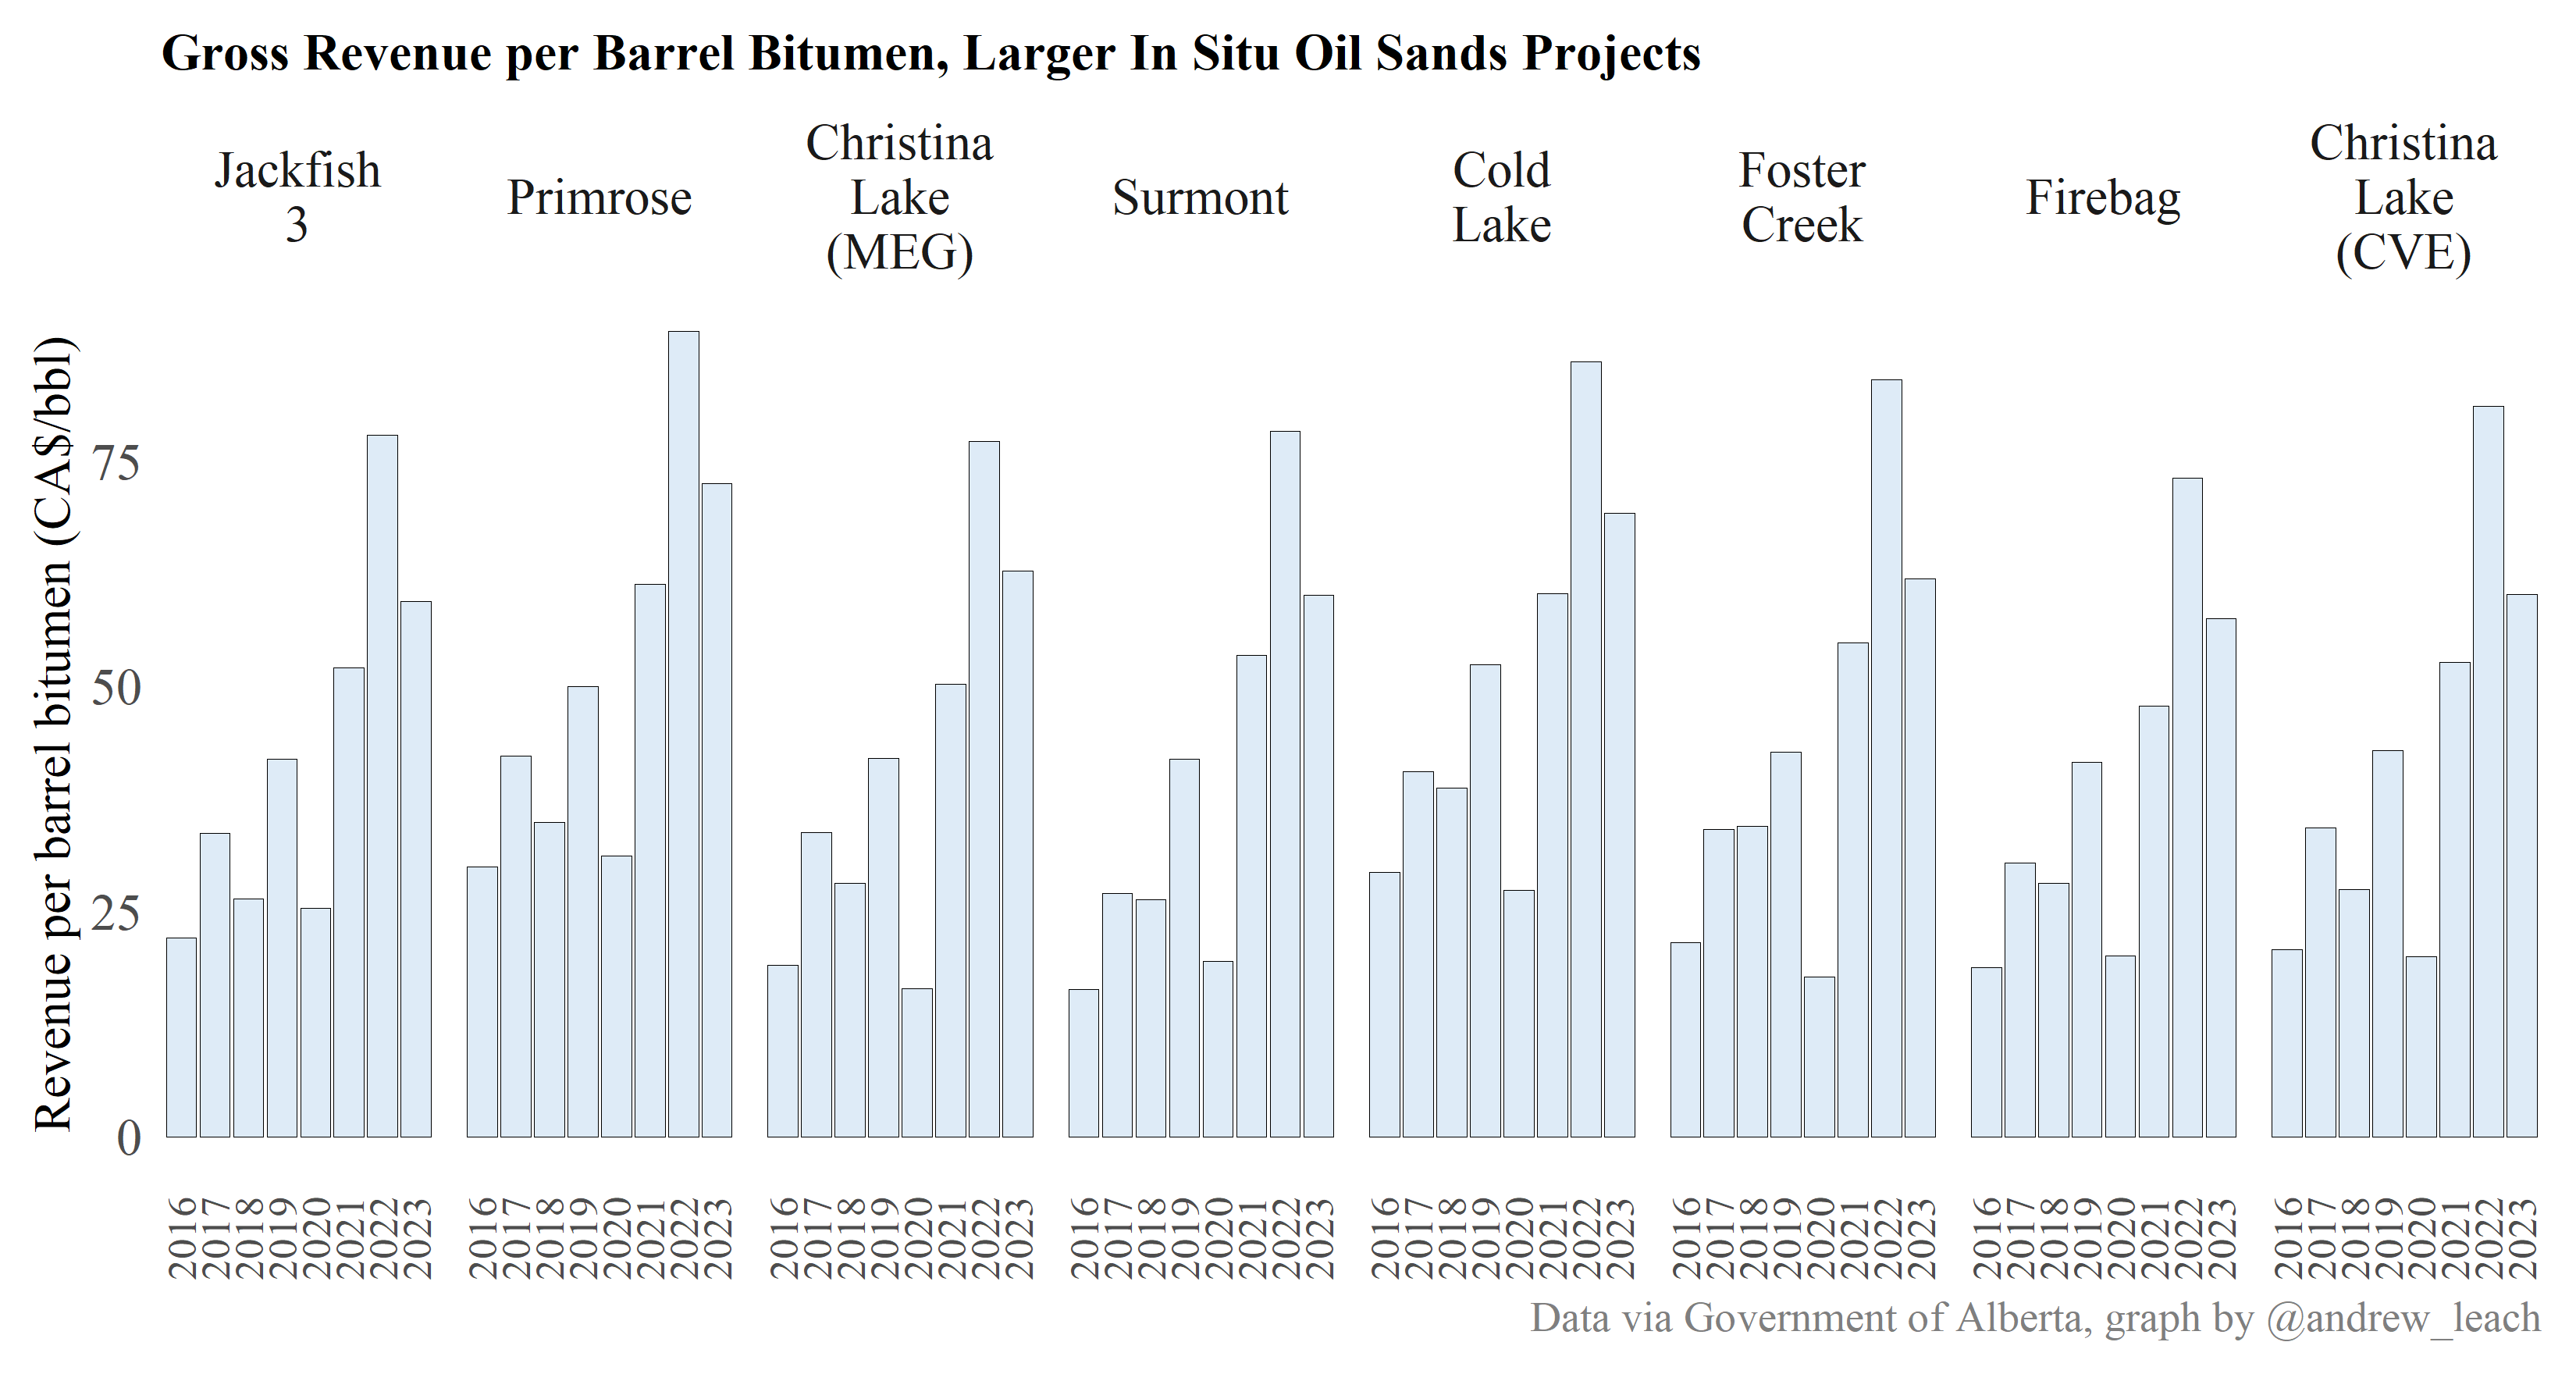
You can access the data here and some background on oil sands royalties here. The historical data and the Alberta Revenue Workbook are going to be used in upcoming data exercises.
Mining Production
In Situ Production
Mining Revenue per Barrel
In Situ Revenue Per Barrel
Sustaining capital costs
- Ongoing investment for maintenance of large facilities, including pipelines, well-pads, etc.
- Sustaining capital cost captures large expenditures, so does not include all maintenance
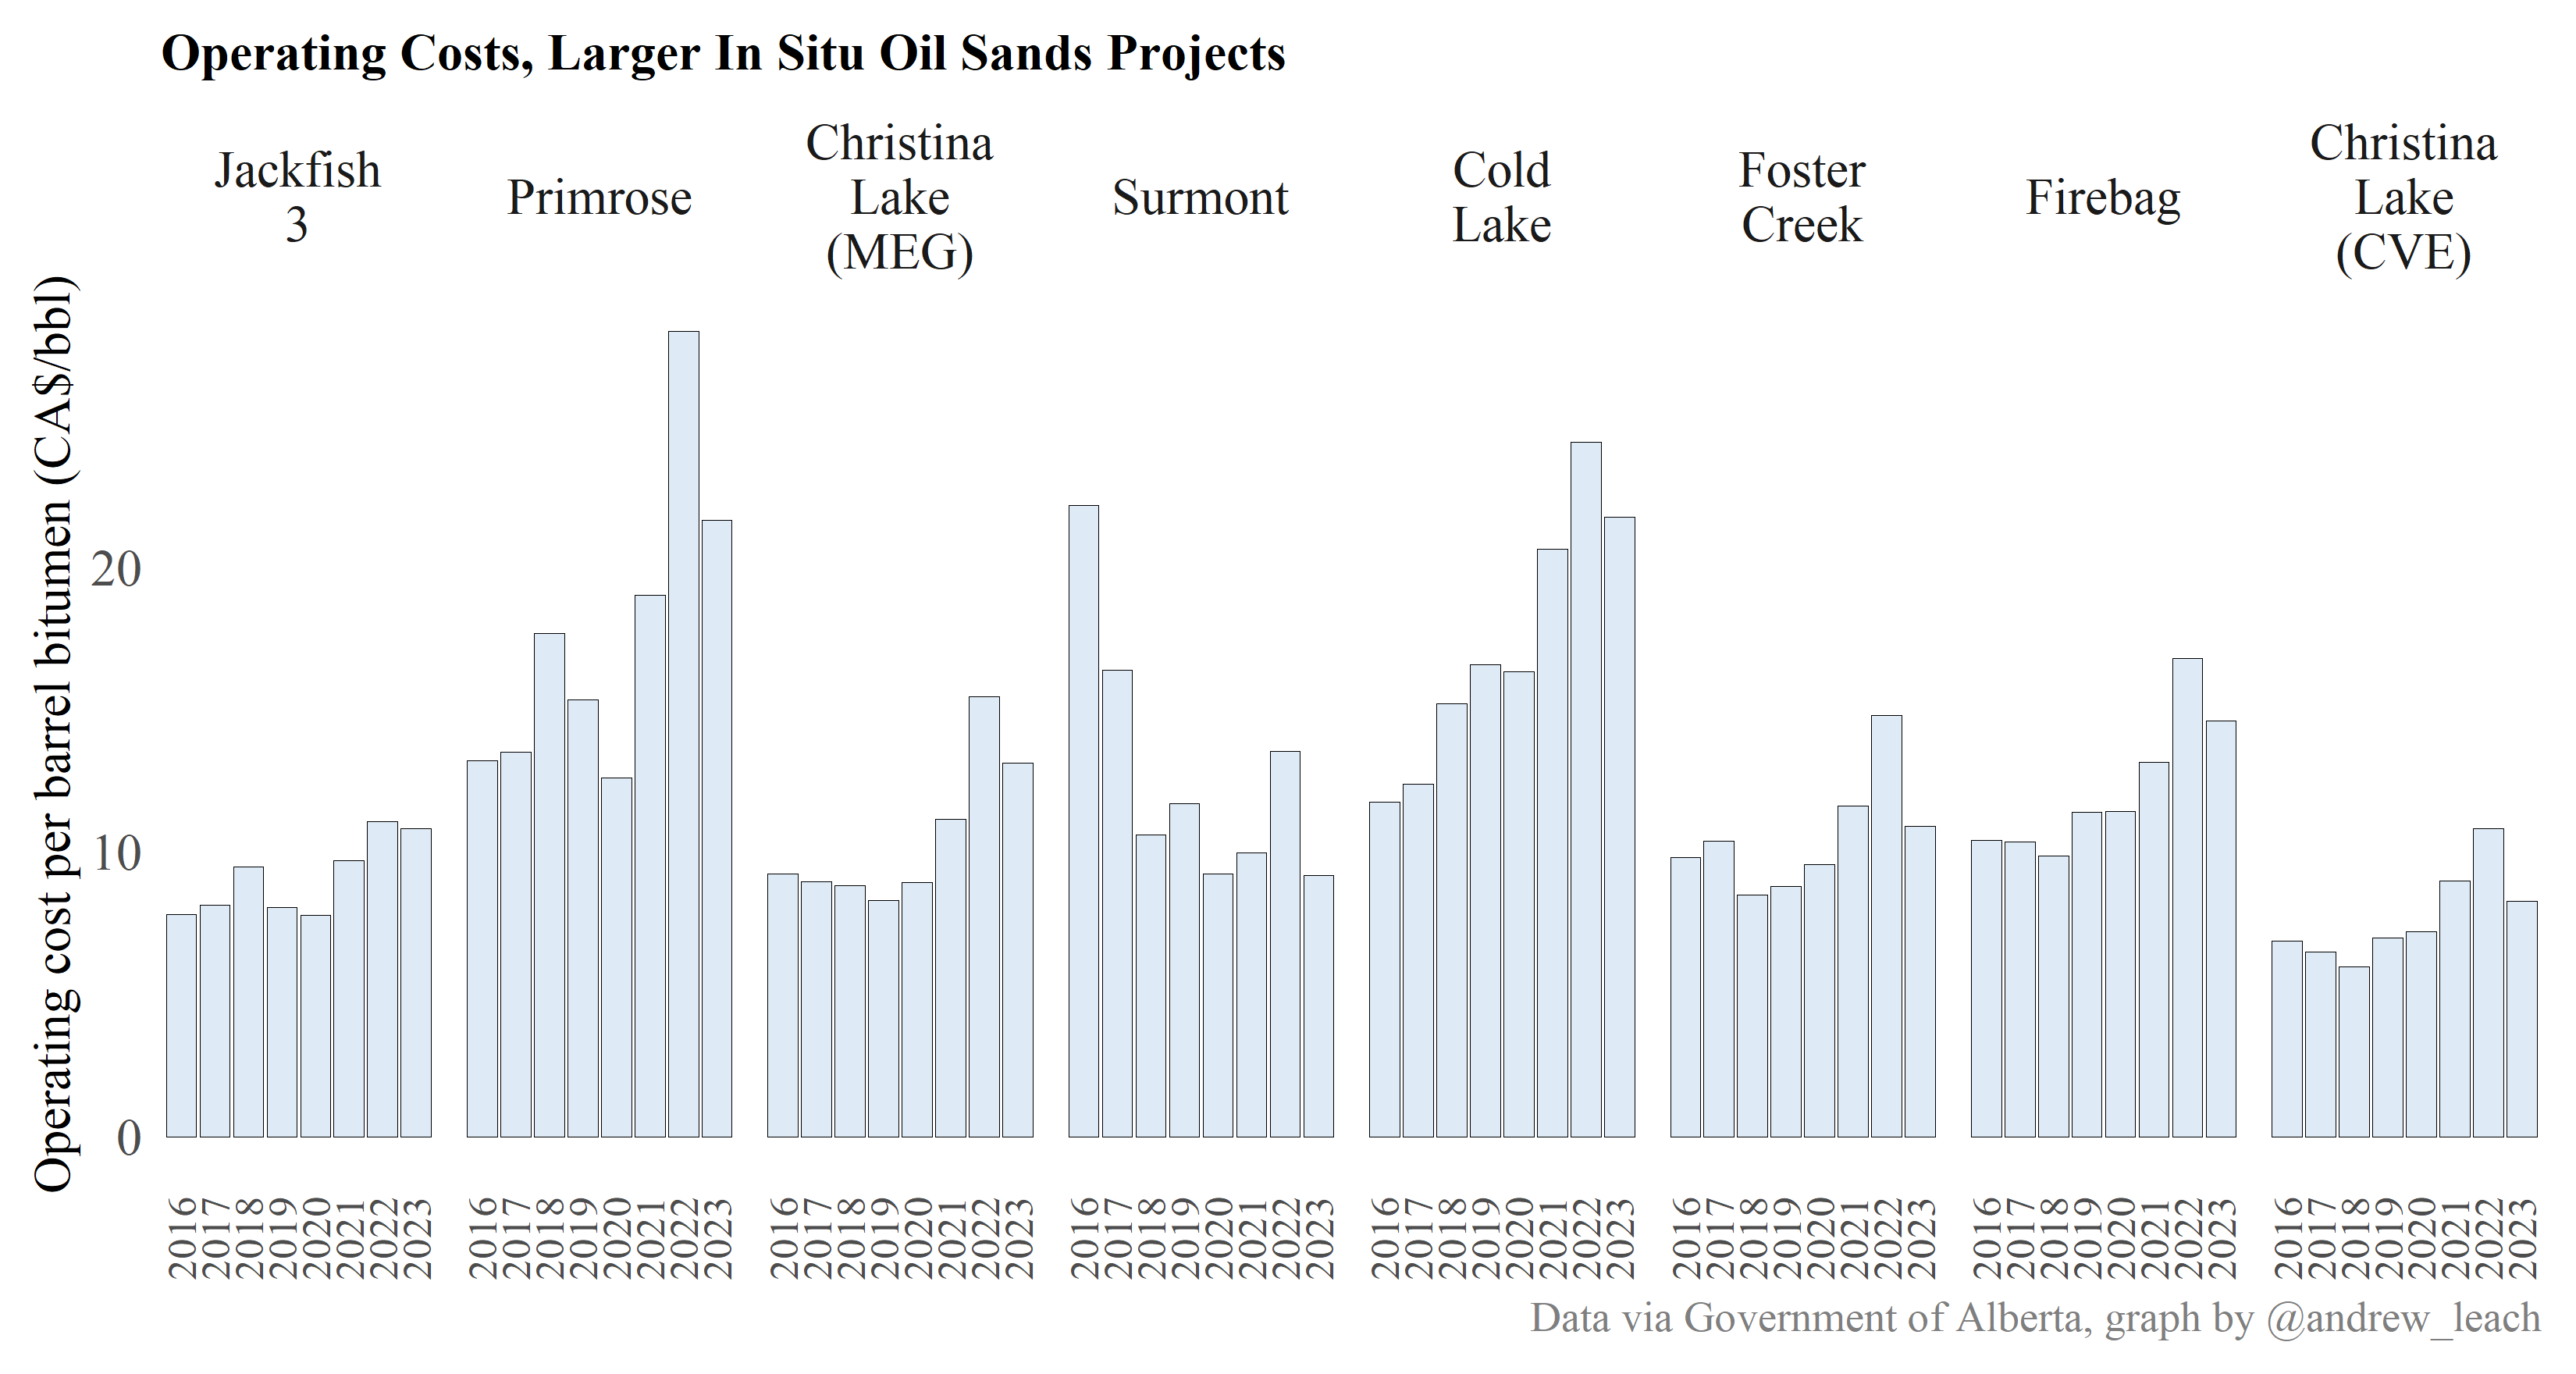
- Typical values are between $10-12/bbl produced for SAGD facilities, and $6-8 per barrel produced for mining operations
Operating costs
- Traditionally separated into gas and non-gas operating costs
- Natural gas is the single largest component for SAGD facilities.
- Some cost figures will also report labour costs as separate components of operating and sustaining capital expenditures
- Highly variable at the facility level
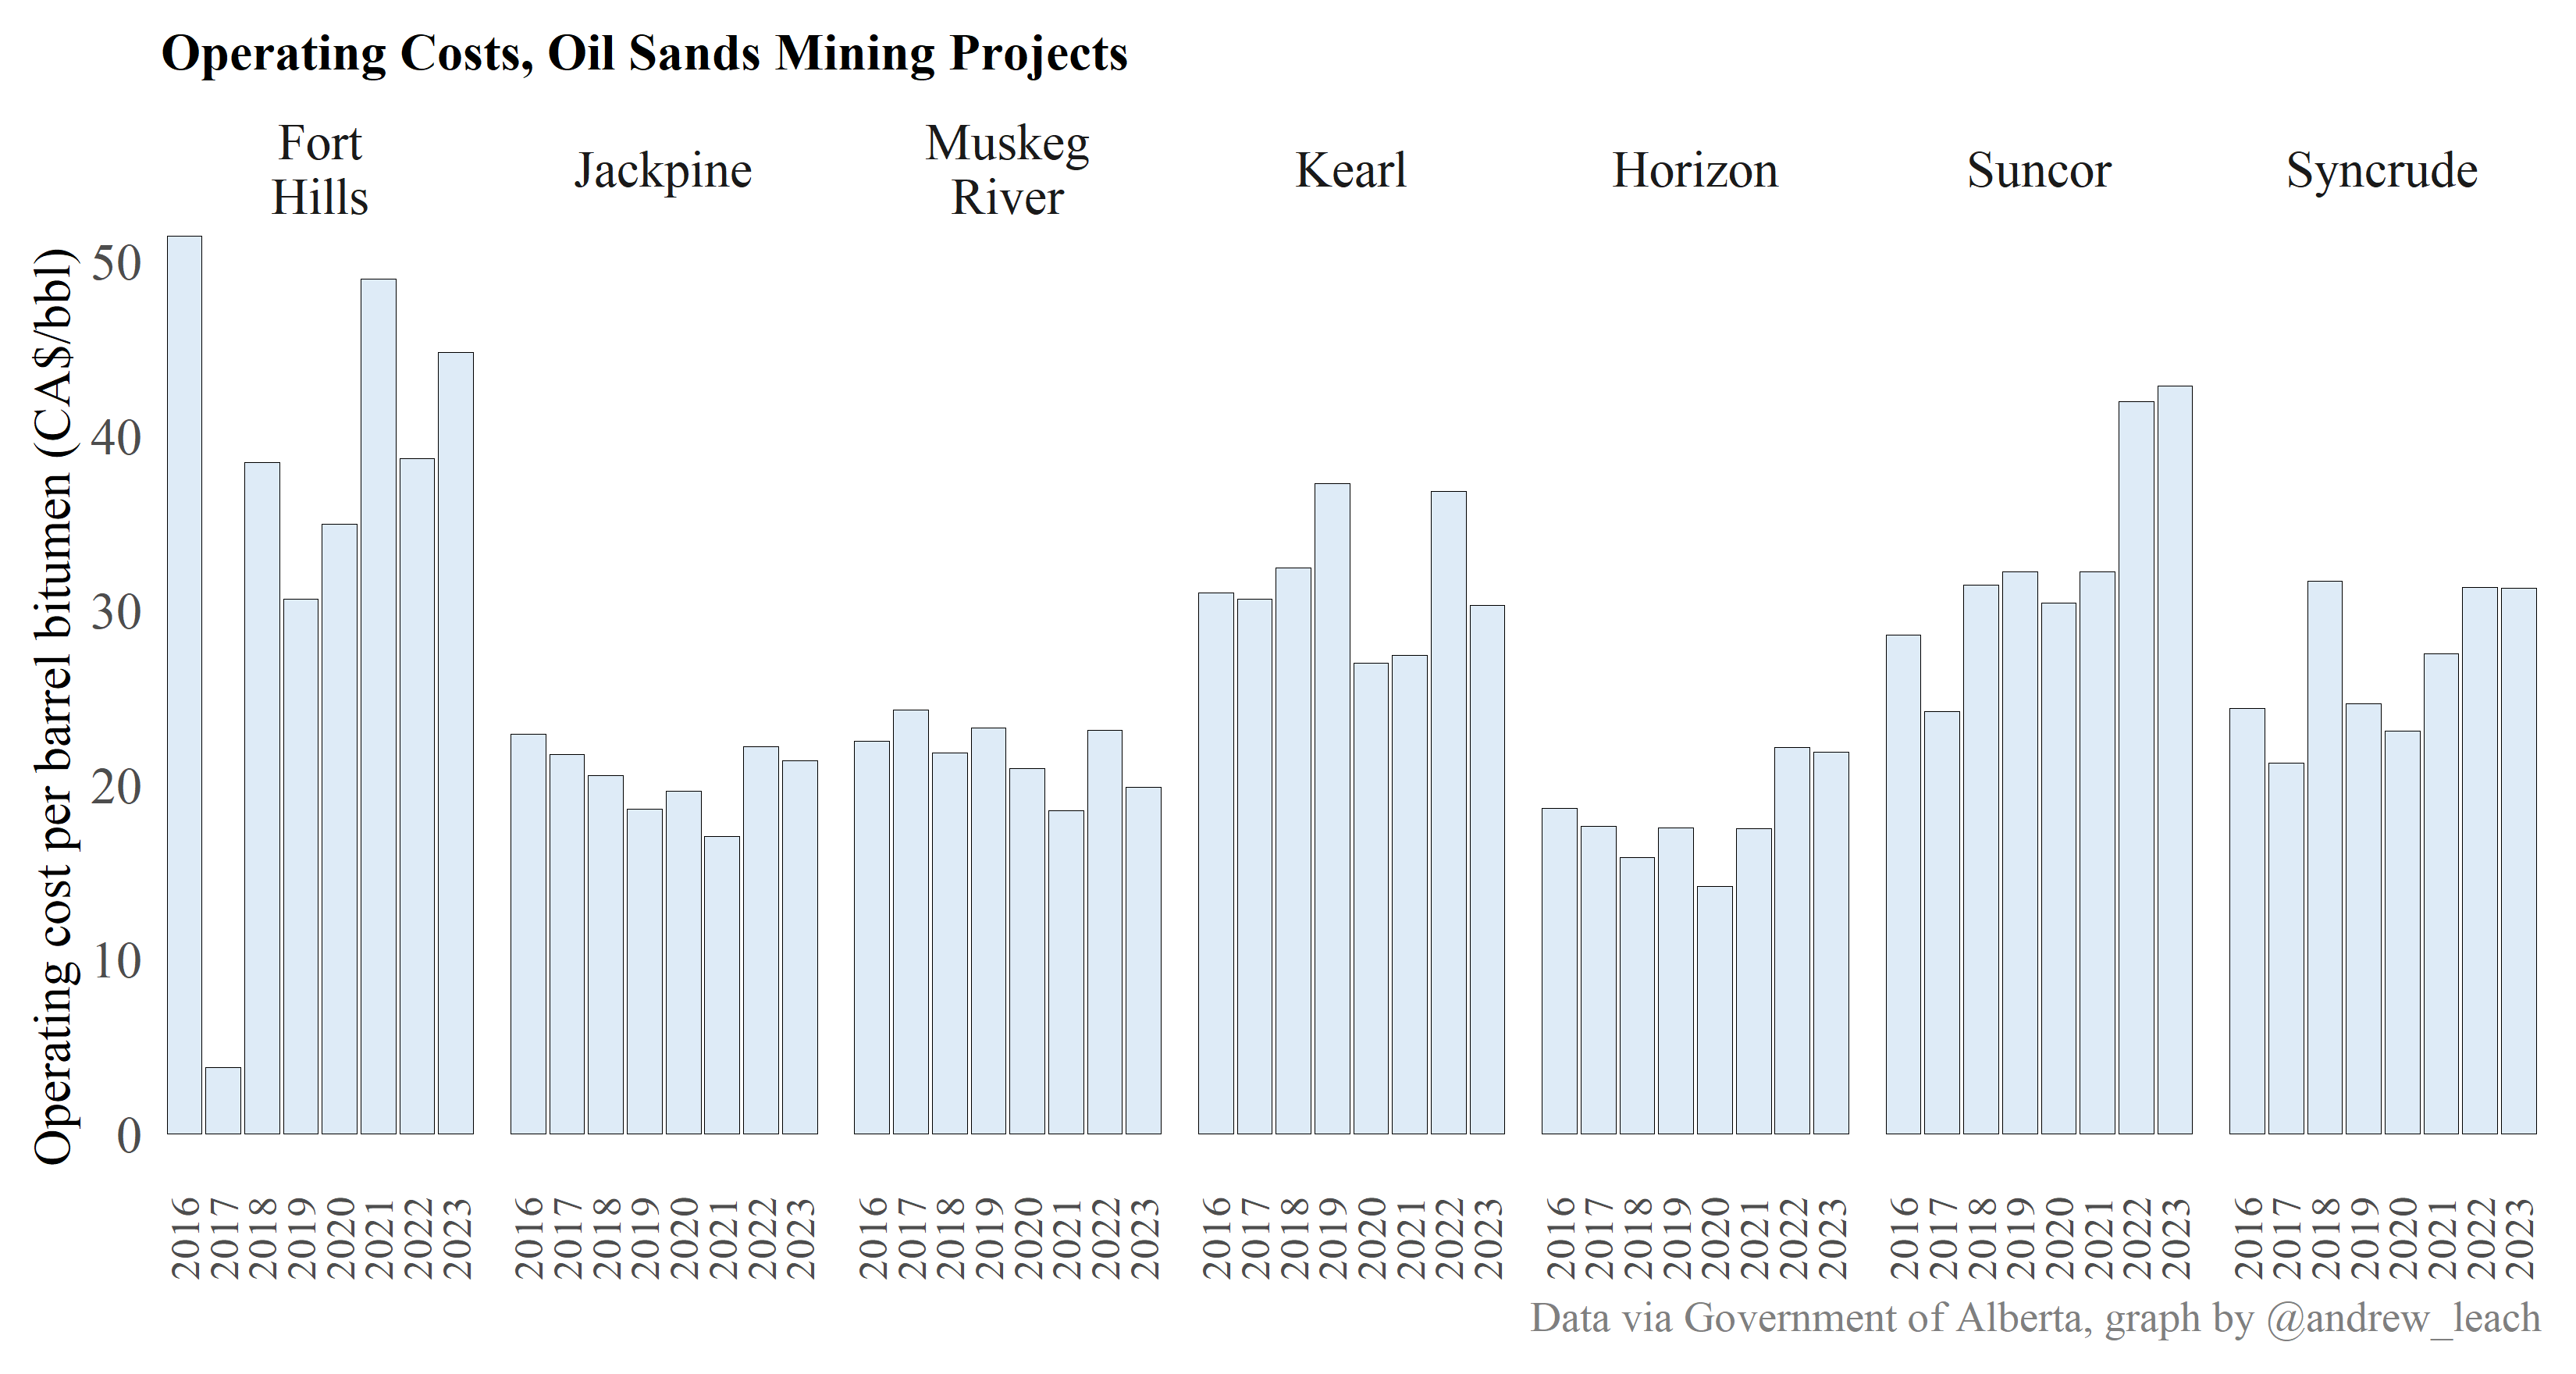
- SAGD facilities tend to be in the $5-15/bbl range
- Mining facilities have increased significantly, to $25-30/bbl (bitumen) ranges, with $40-50/bbl SCO costs in some years
- Kearl, the only mine to not upgrade bitumen, had reported operating costs at $36-40/bbl, those decreased by about $10/bbl when the next phase came online
- Fort Hills is...well not good
Mining Operating Costs
In Situ Operating Costs
Fiscal policies
- Oil sands were, for a long time, the most interesting royalty issue in the province
- Historically, oil sands operations were marginal projects
- Significant dependence on the price of oil
- Role for government to encourage investment to create jobs, stimulate the economy
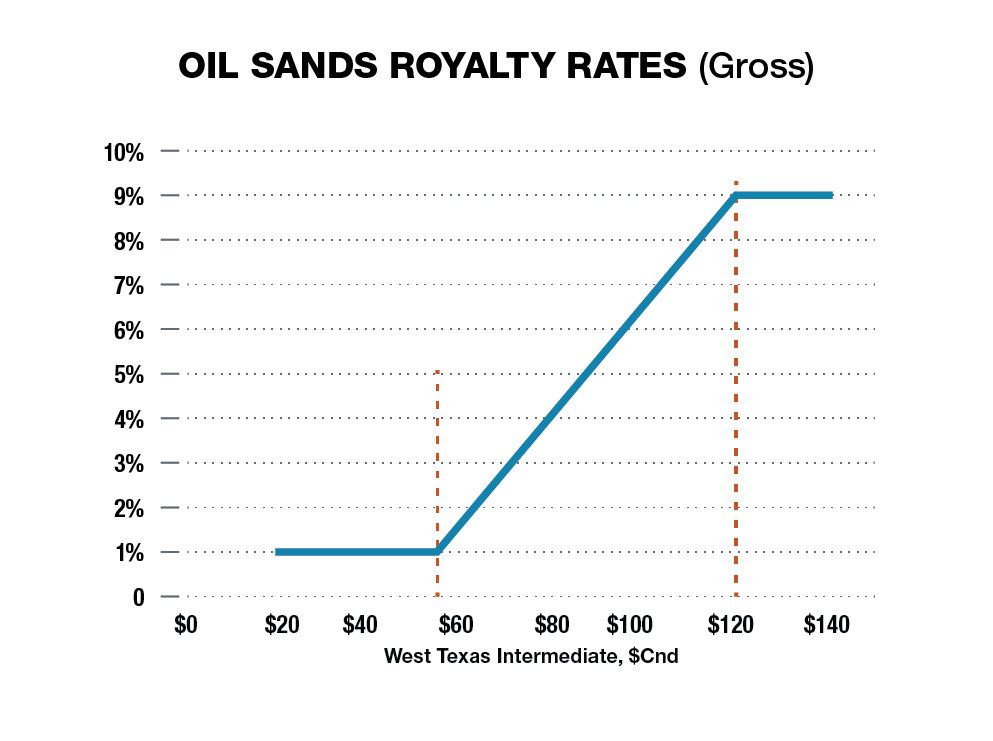
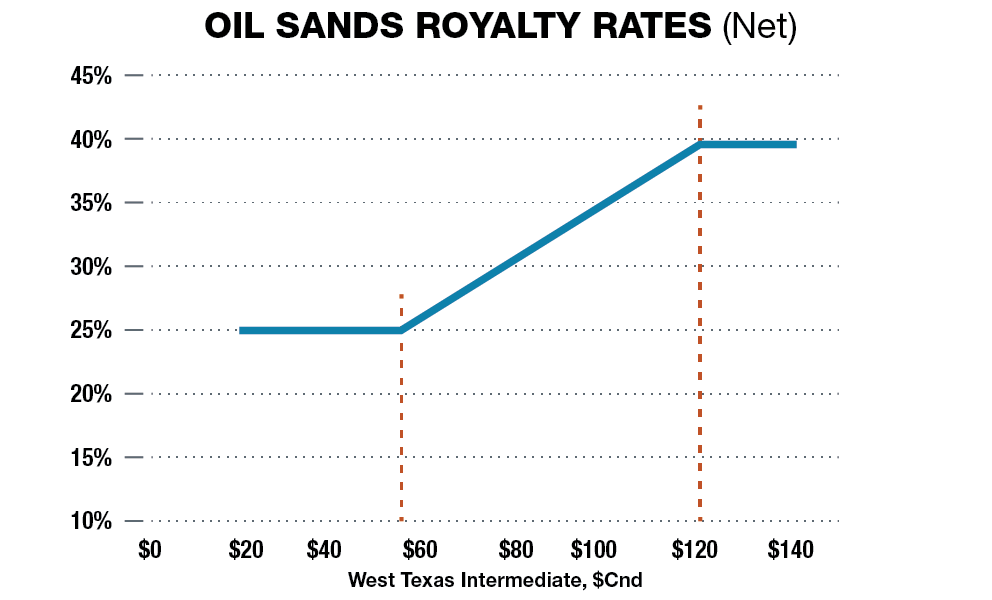
- Generic oil sands royalty regime imposed royalty rates at a fixed 1% of gross revenues until the project costs had been recovered, 25% of net revenues afterwards
- 2008 regime introduced a sliding scale for both the base rate and the post-payout rate based on prices
- Environmental costs were recognized as project costs after 2008
- 2015 Royalty Review largely left oil sands royalties unchanged
- Long run oil price outlook may make new projects challenging regardless of royalty structure
What makes a good royalty regime?
Oil Sands Royalties
- Base royalty rate of 1% for $55/bbl and below, increasing linearly to 9% for $120/bbl
- Post-payout royalty rate of 25% up to $55/bbl, and increasing linearly to 40% for $120/bbl and above
Royalties depend on oil prices, but what oil price, when and where?
the WTI (Cushing) price for a given month, expressed in Canadian currency, calculated as the product of:
a. the simple average of the WTI prices for the trading days of the preceding month expressed in American currency, and
b. the simple average of the daily actual USD/CAD (noon) exchange rates for that month.
Net Revenue Calculation
What's the net revenue for the purposes of royalty calculations?
The amount by which the project's revenue exceeds allowed costs, minus other net proceeds. Net revenue can never be below zero.
Calculated as Gross Revenue – Operating Costs – Capital Costs – Return Allowance – Other Costs + Other Net Proceeds.
Financing costs are exempt from net revenue calculations
Payout Calculation
How do you know if a project has paid back its initial investment and you're paying a net or a gross revenue royalty?
Project payout occurs when a project’s cumulative revenues first equal or exceed its cumulative costs. Royalties are typically higher in the post-payout phase. Once a project achieves payout it remains in the post-payout phase.
Payout calculation assumes unrecovered capital costs are carried at the Government Long Term Bond Rate. Think of a virtual line of credit where all expenses are spent via the line, and all revenues deposits to pay back the line. When the line is paid off, the project has reached payout.
Projects always pay the greater of the calculated net or gross revenue royalty
Gross Revenue Royalty
Net Revenue Royalty
Payment of Royalties
- Always has been “in-kind” for conventional, “in cash” for oil sands
- Government had not wanted to be in the upgrading/refining business, and so did not accept bitumen in lieu of cash
Under the 2008 royalty regime:
“The government intends to have a portion of its royalty share of bitumen in-kind commercially upgraded to higher value products in the province. The government wants to hear from companies interested in buying bitumen from the province for upgrading and other value-added activities in Alberta.”
For our purposes, that's not really important, but it does matter for producers.
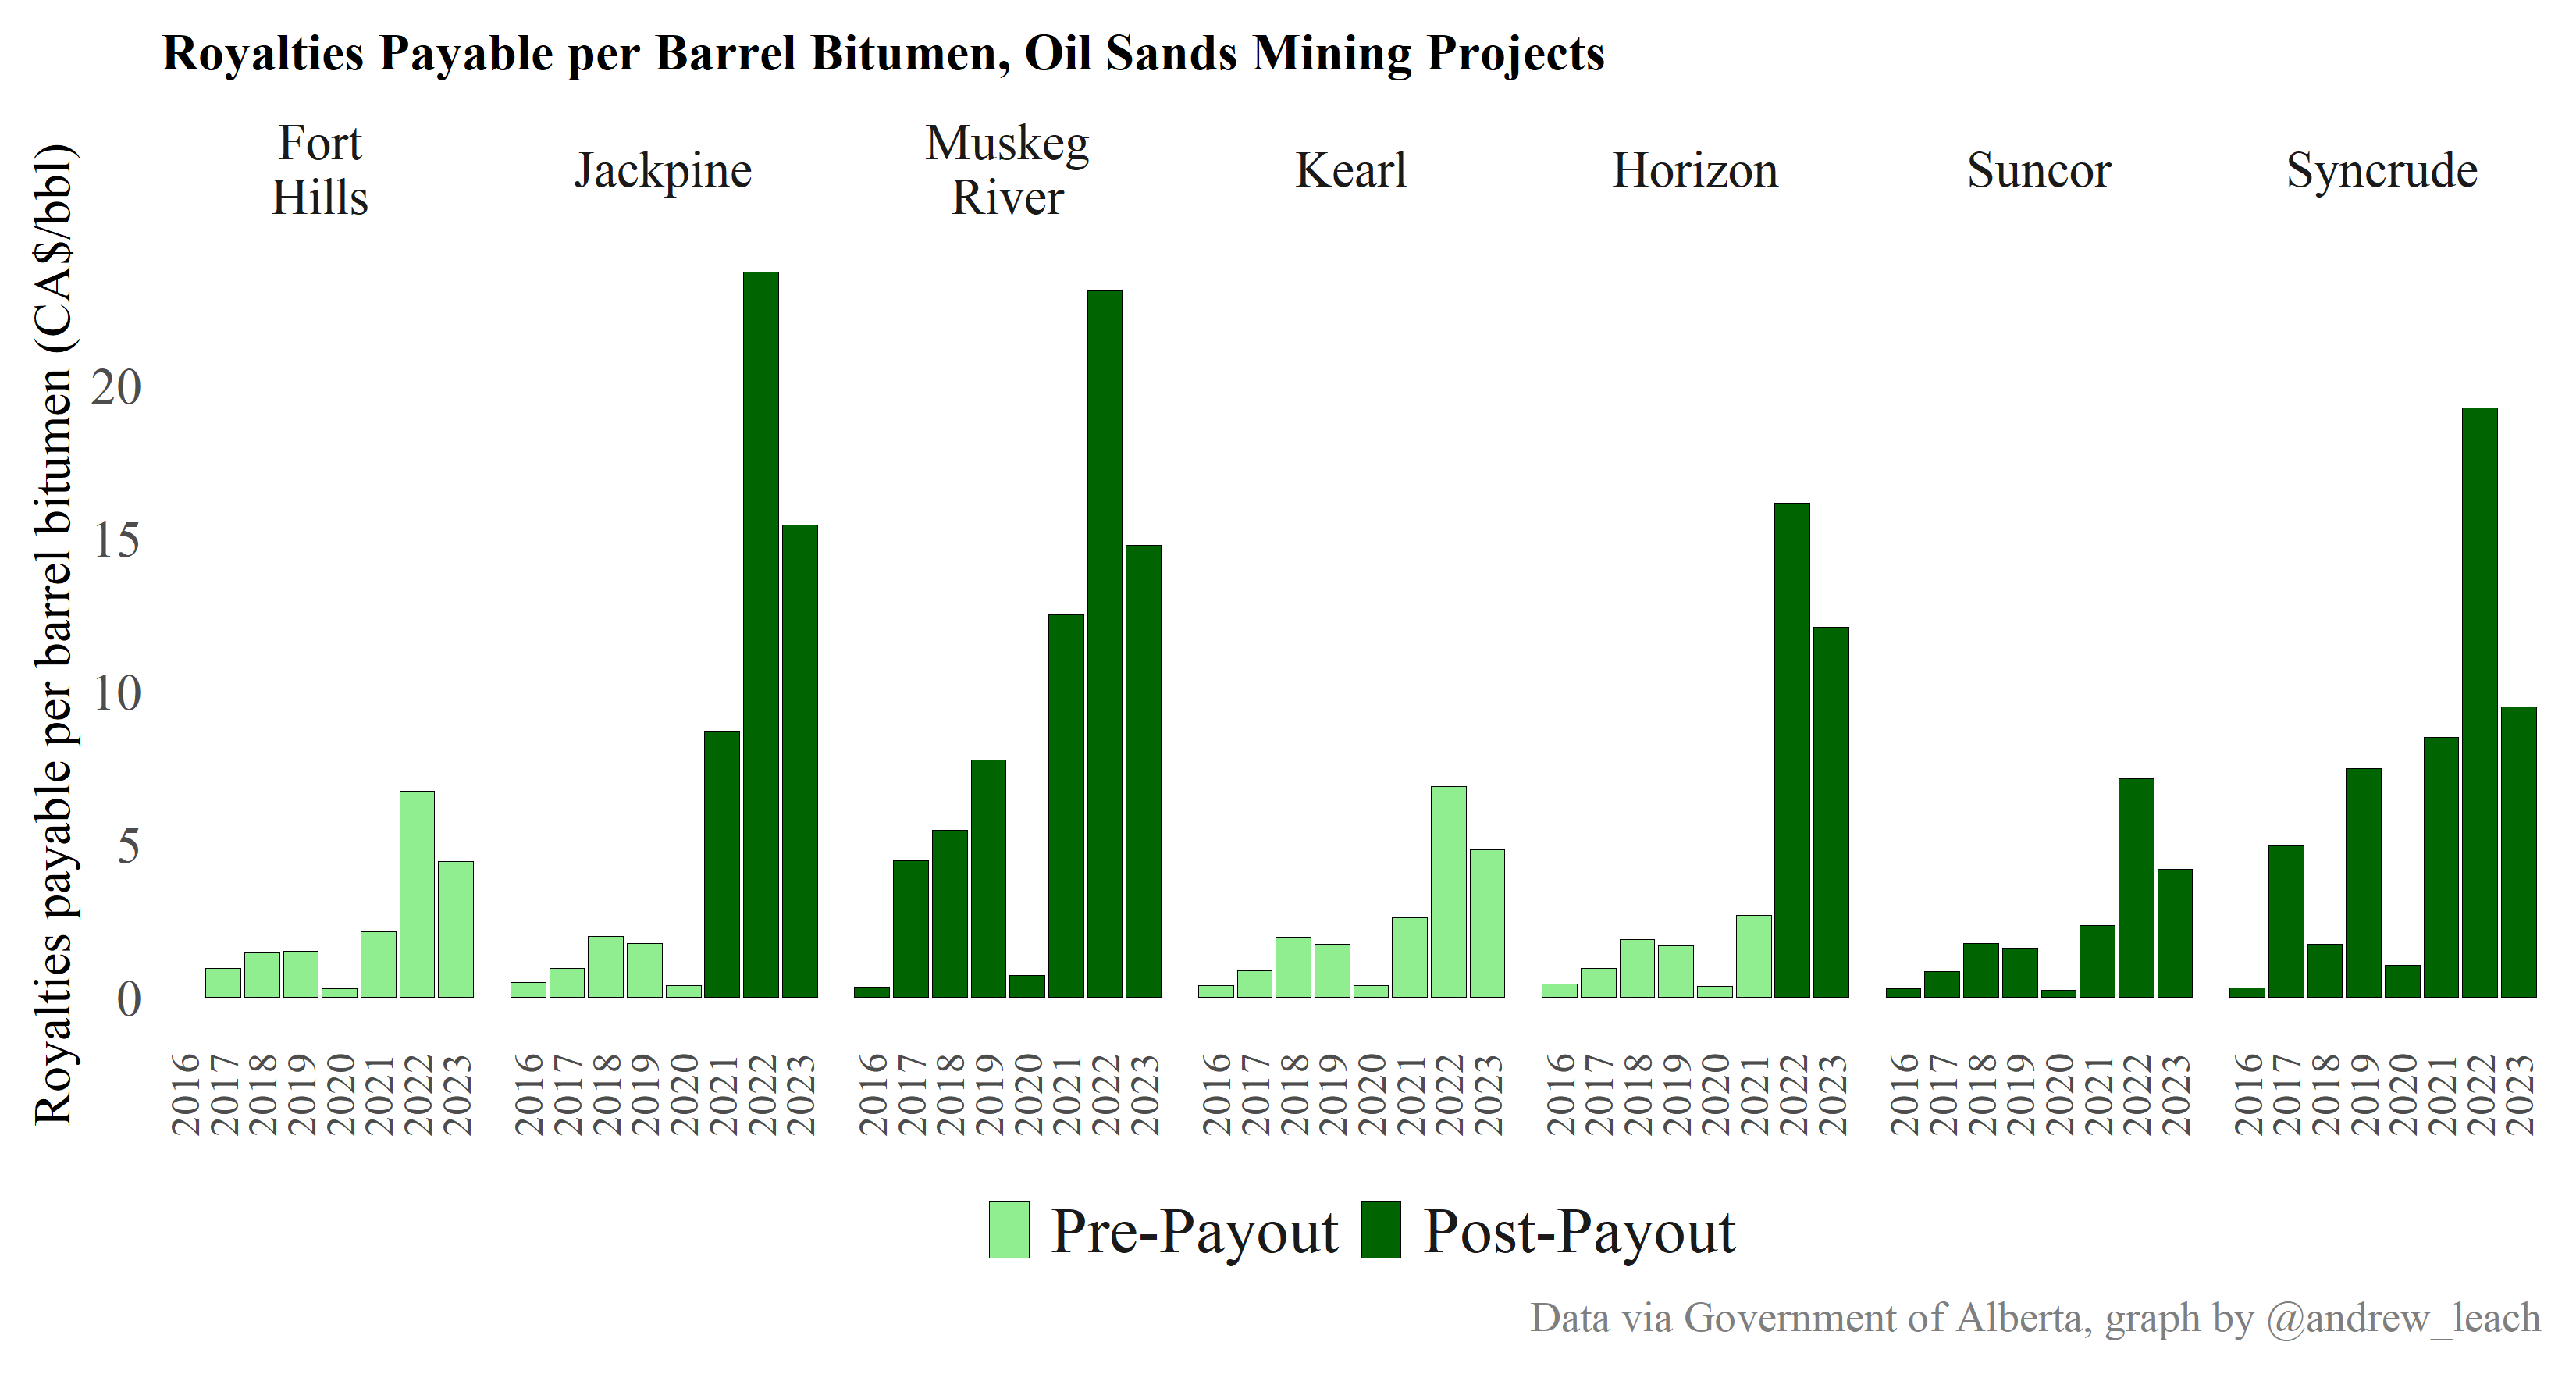
Mining Royalties
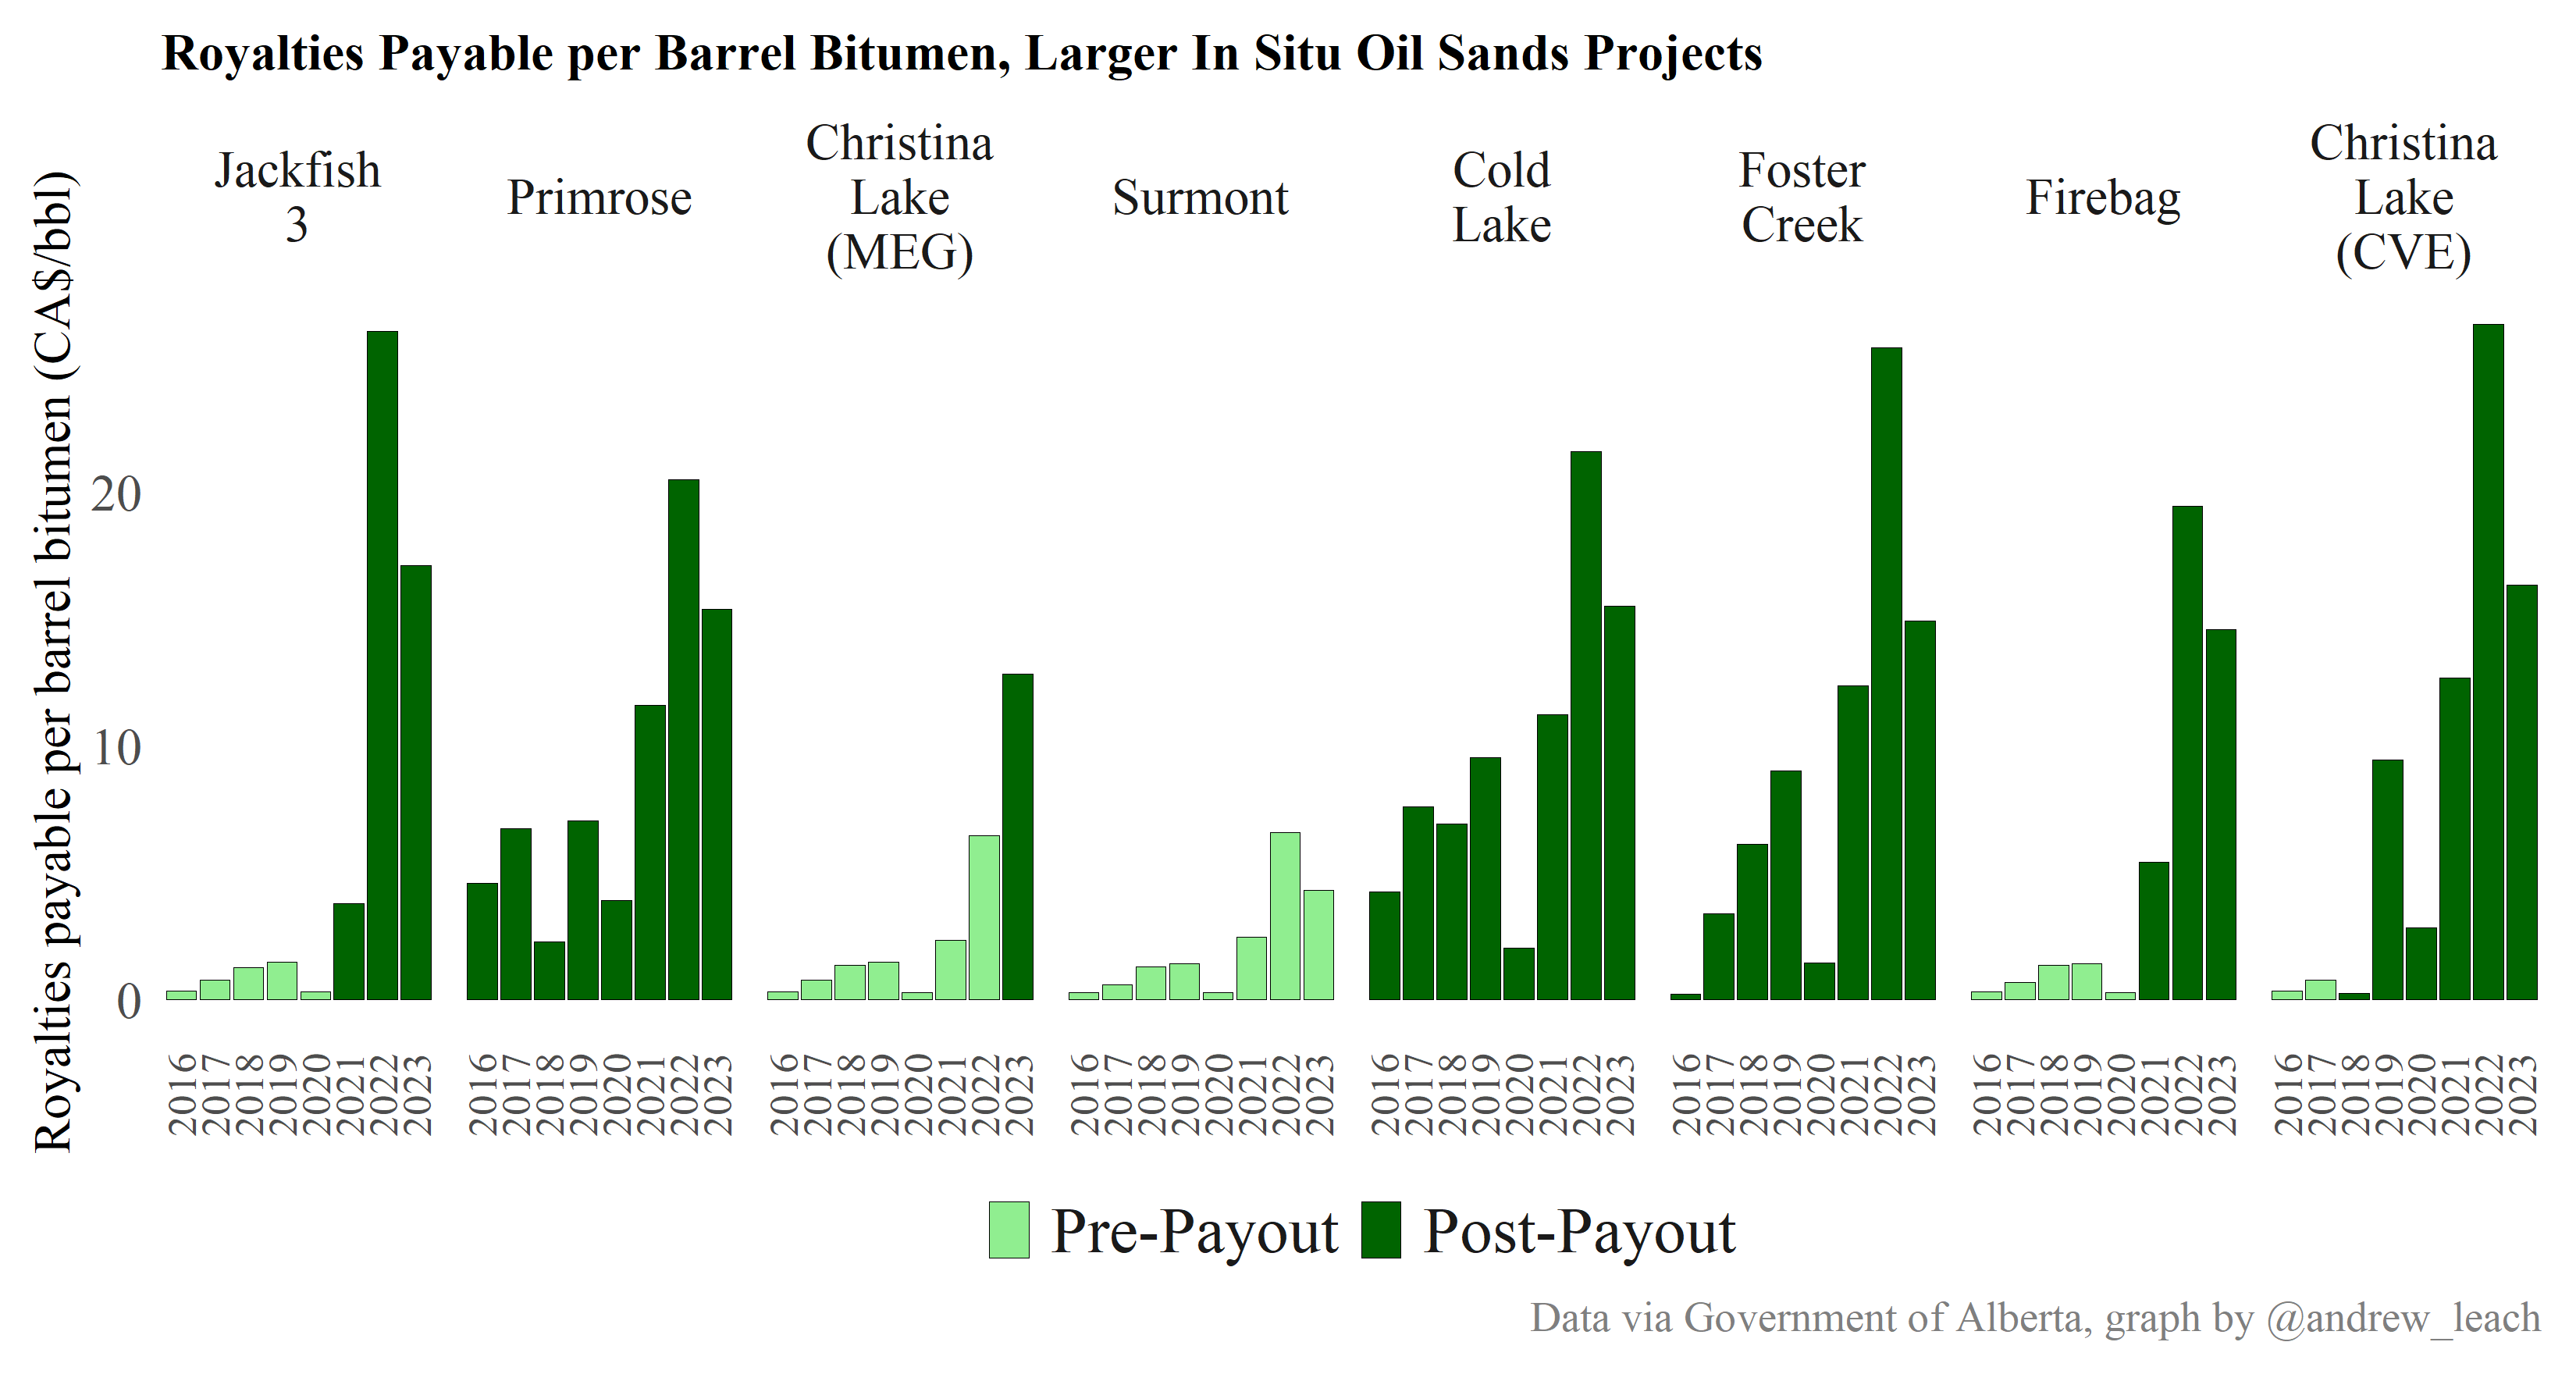
In Situ Royalties
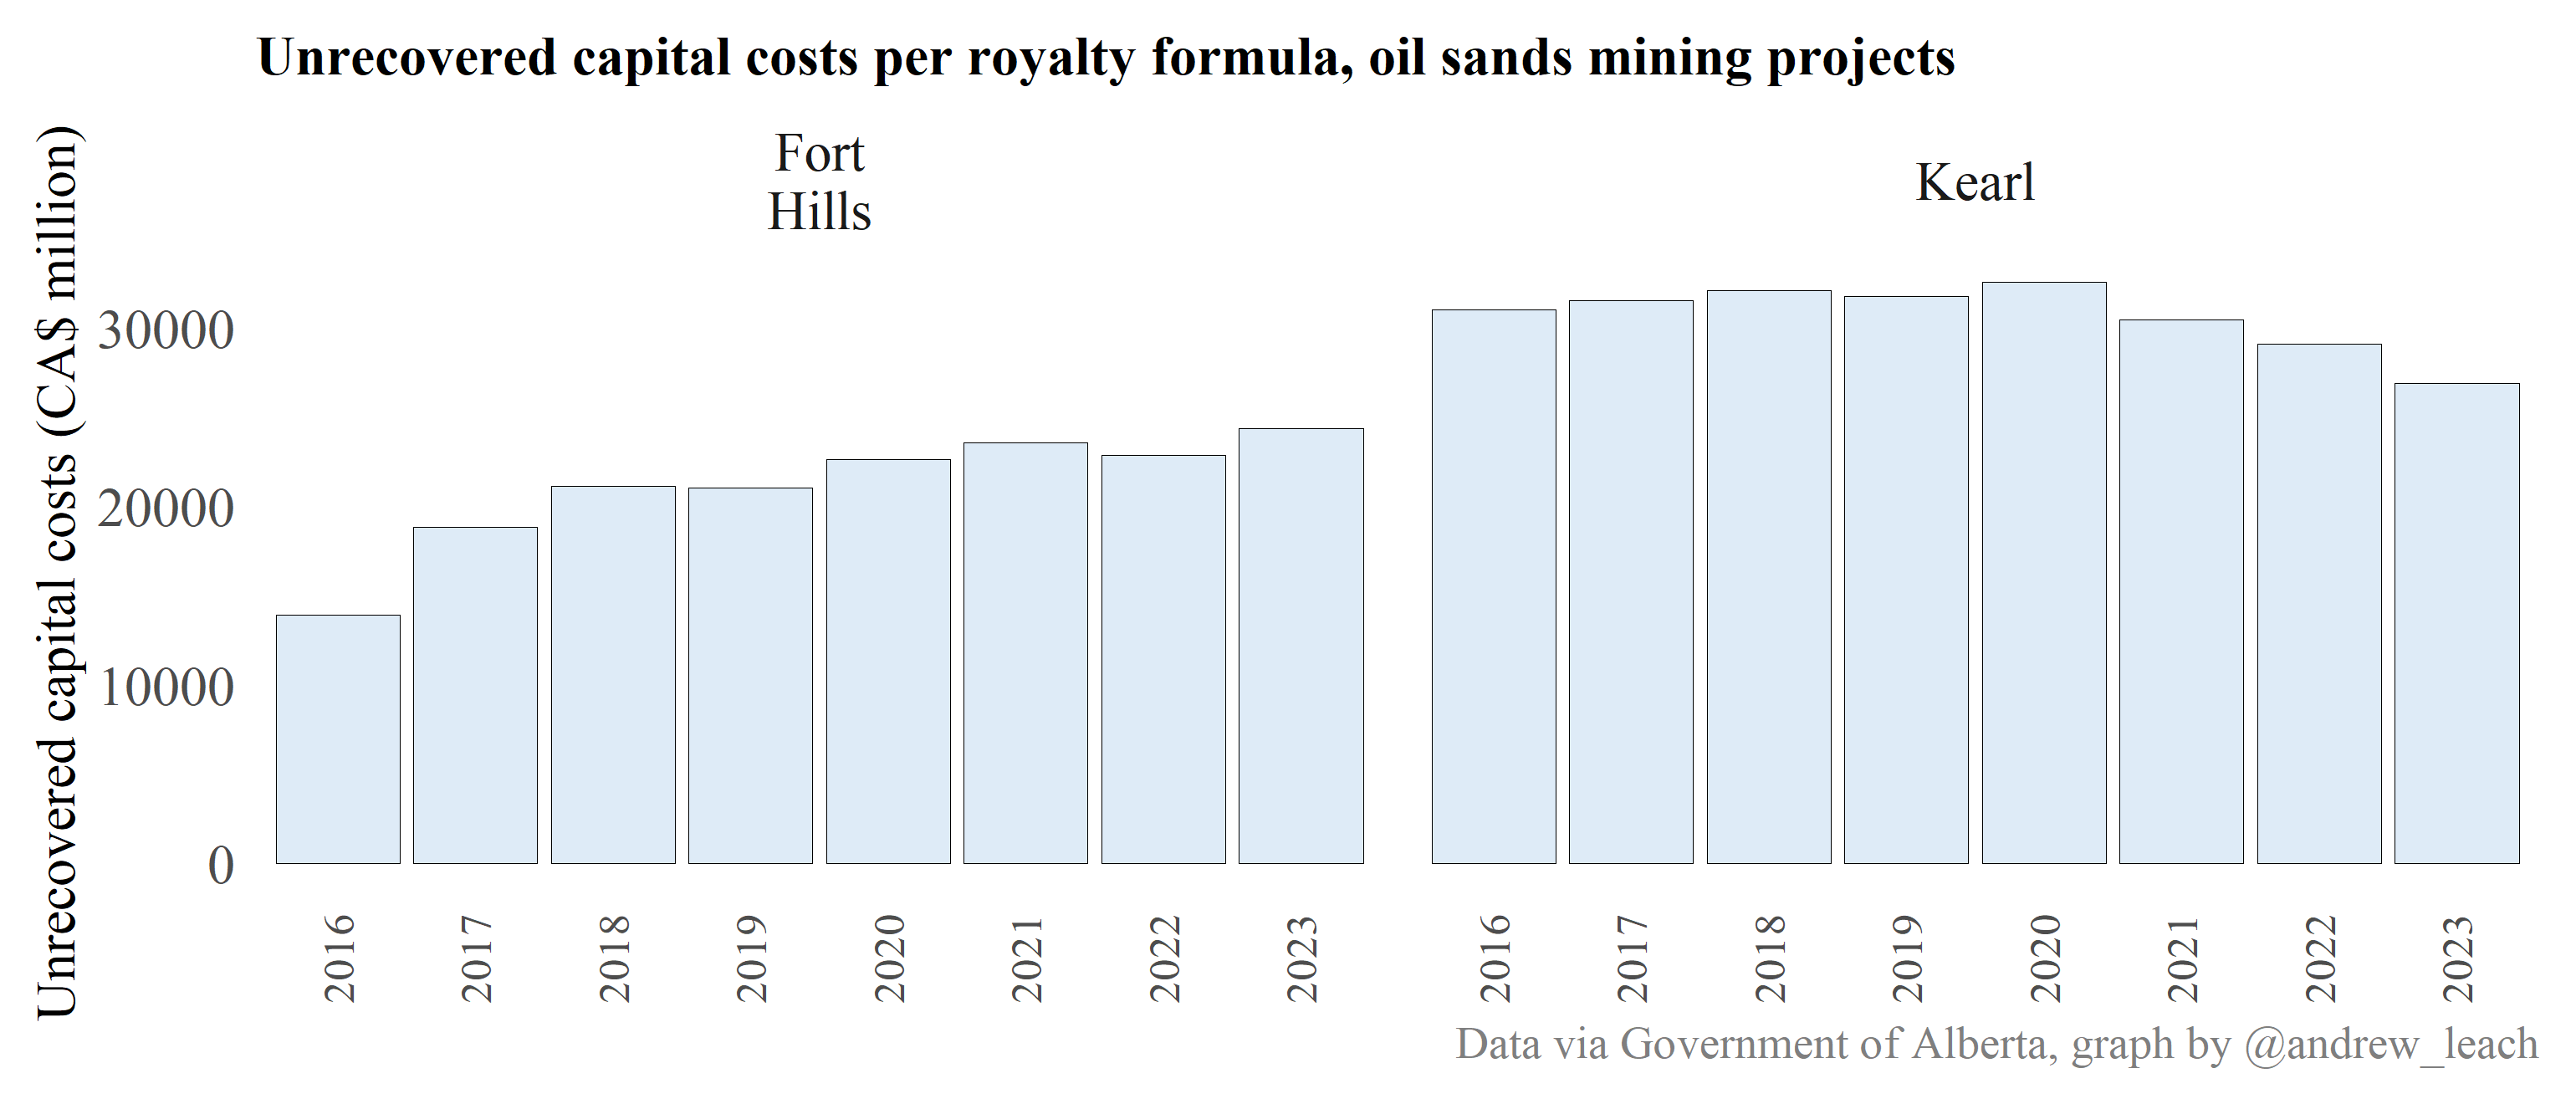
Mining unrecovered capital costs
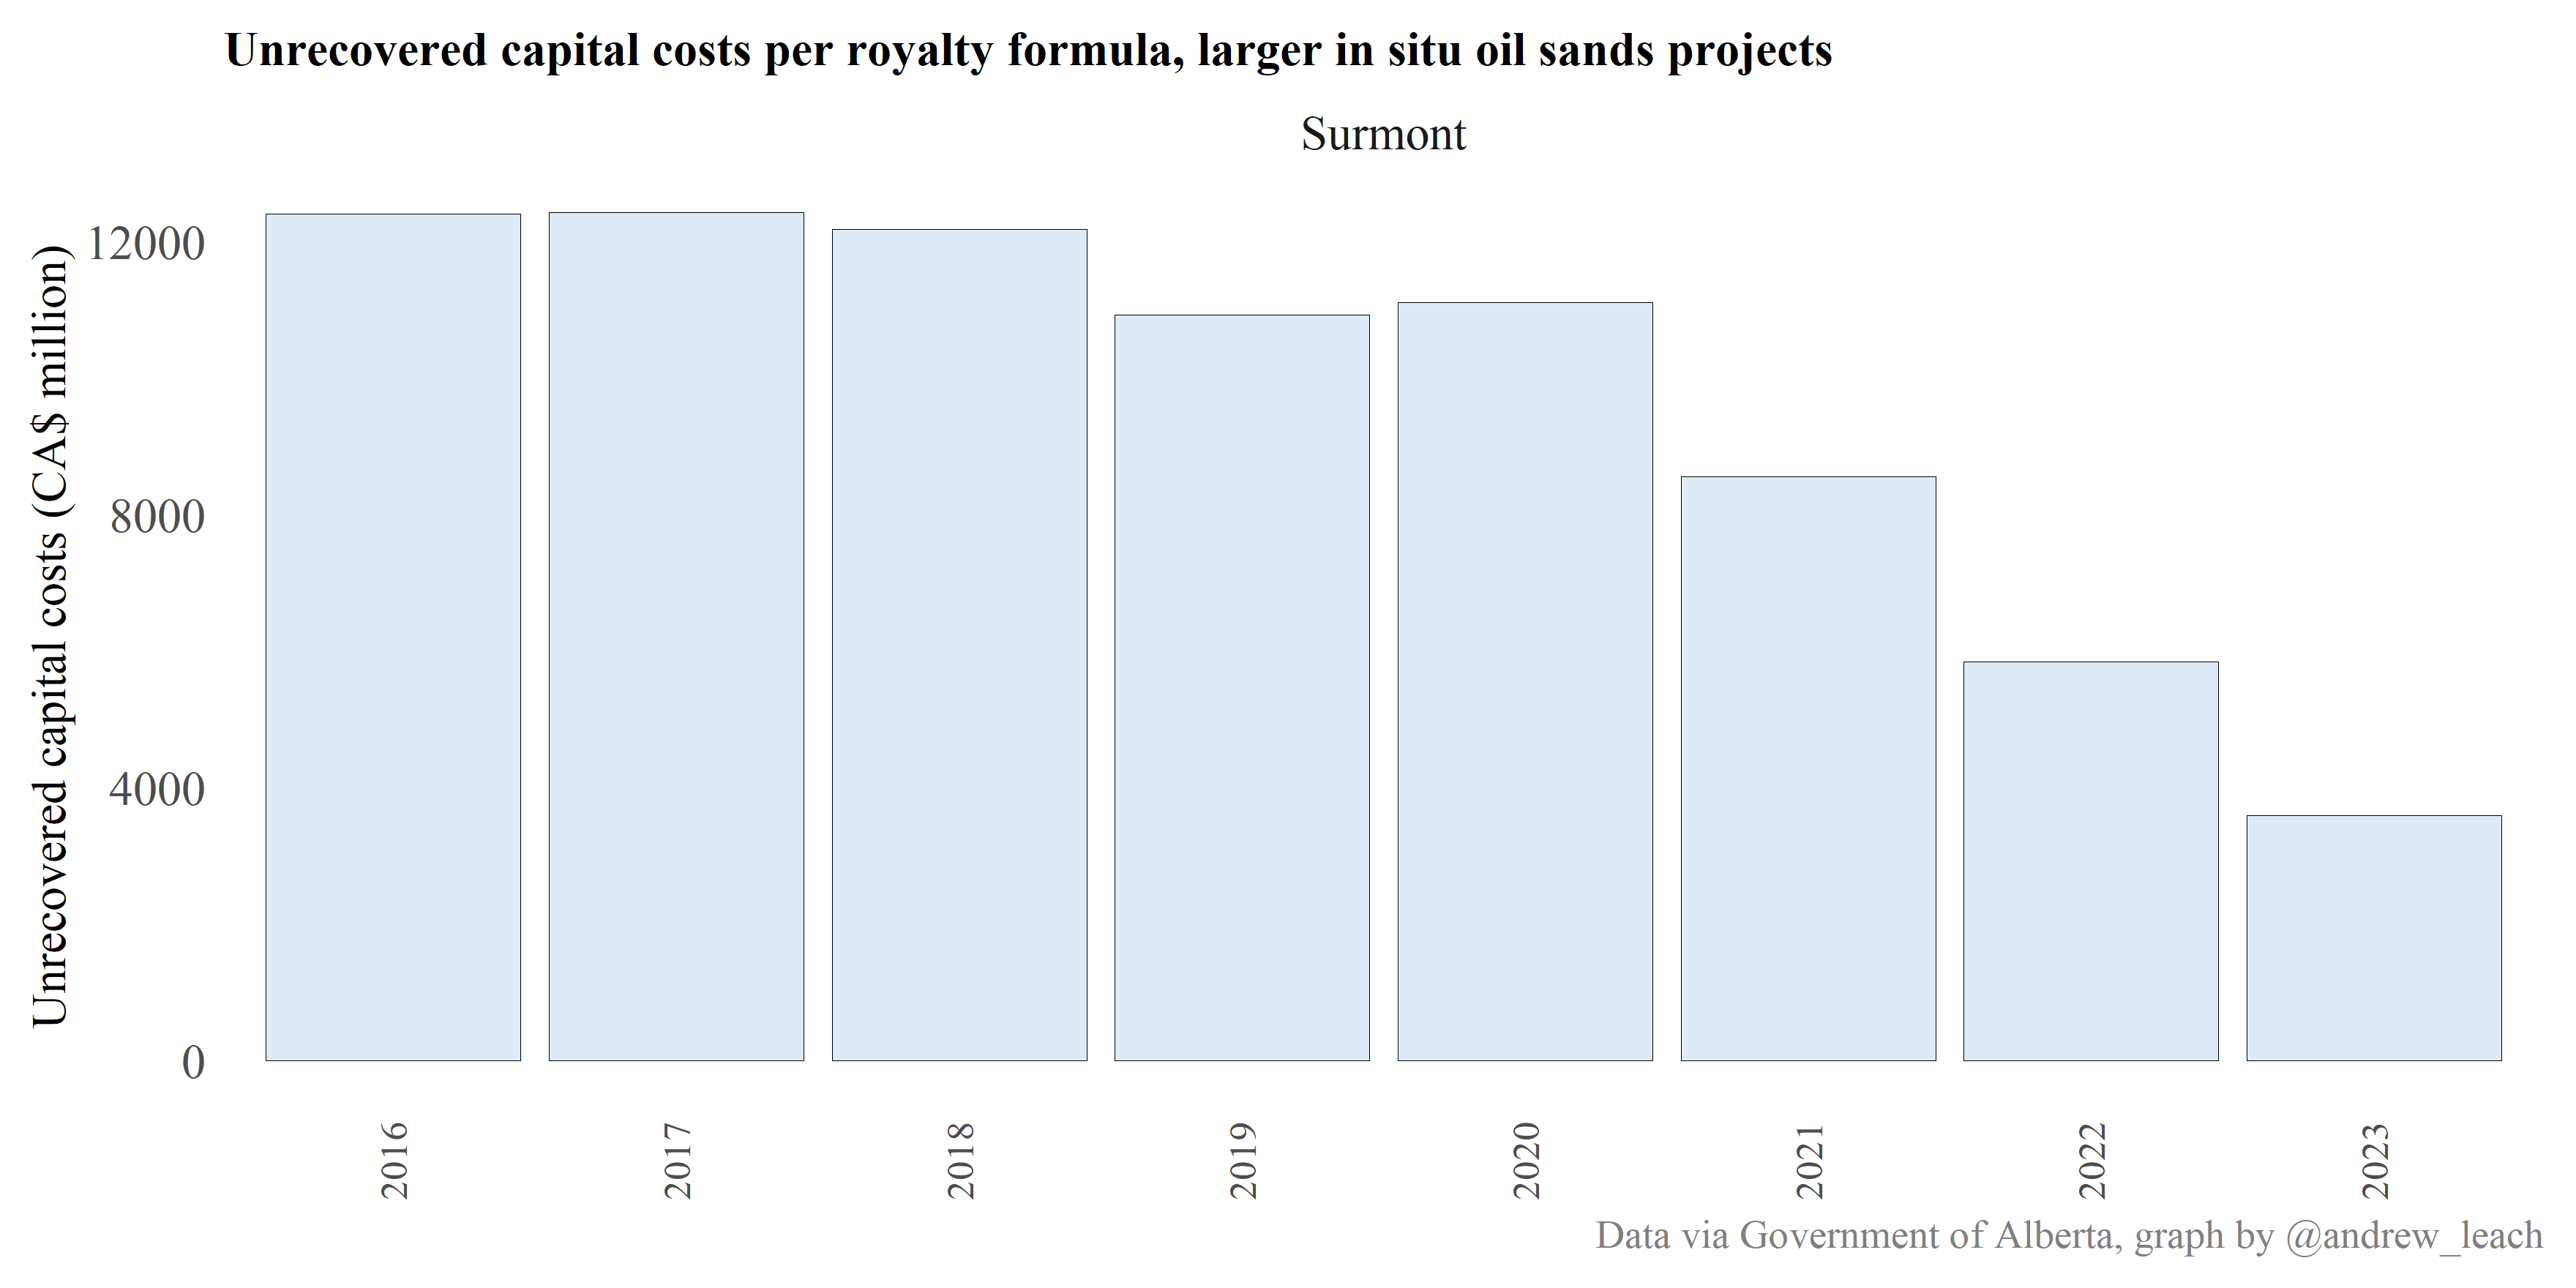
In Situ Unrecovered Capital Costs
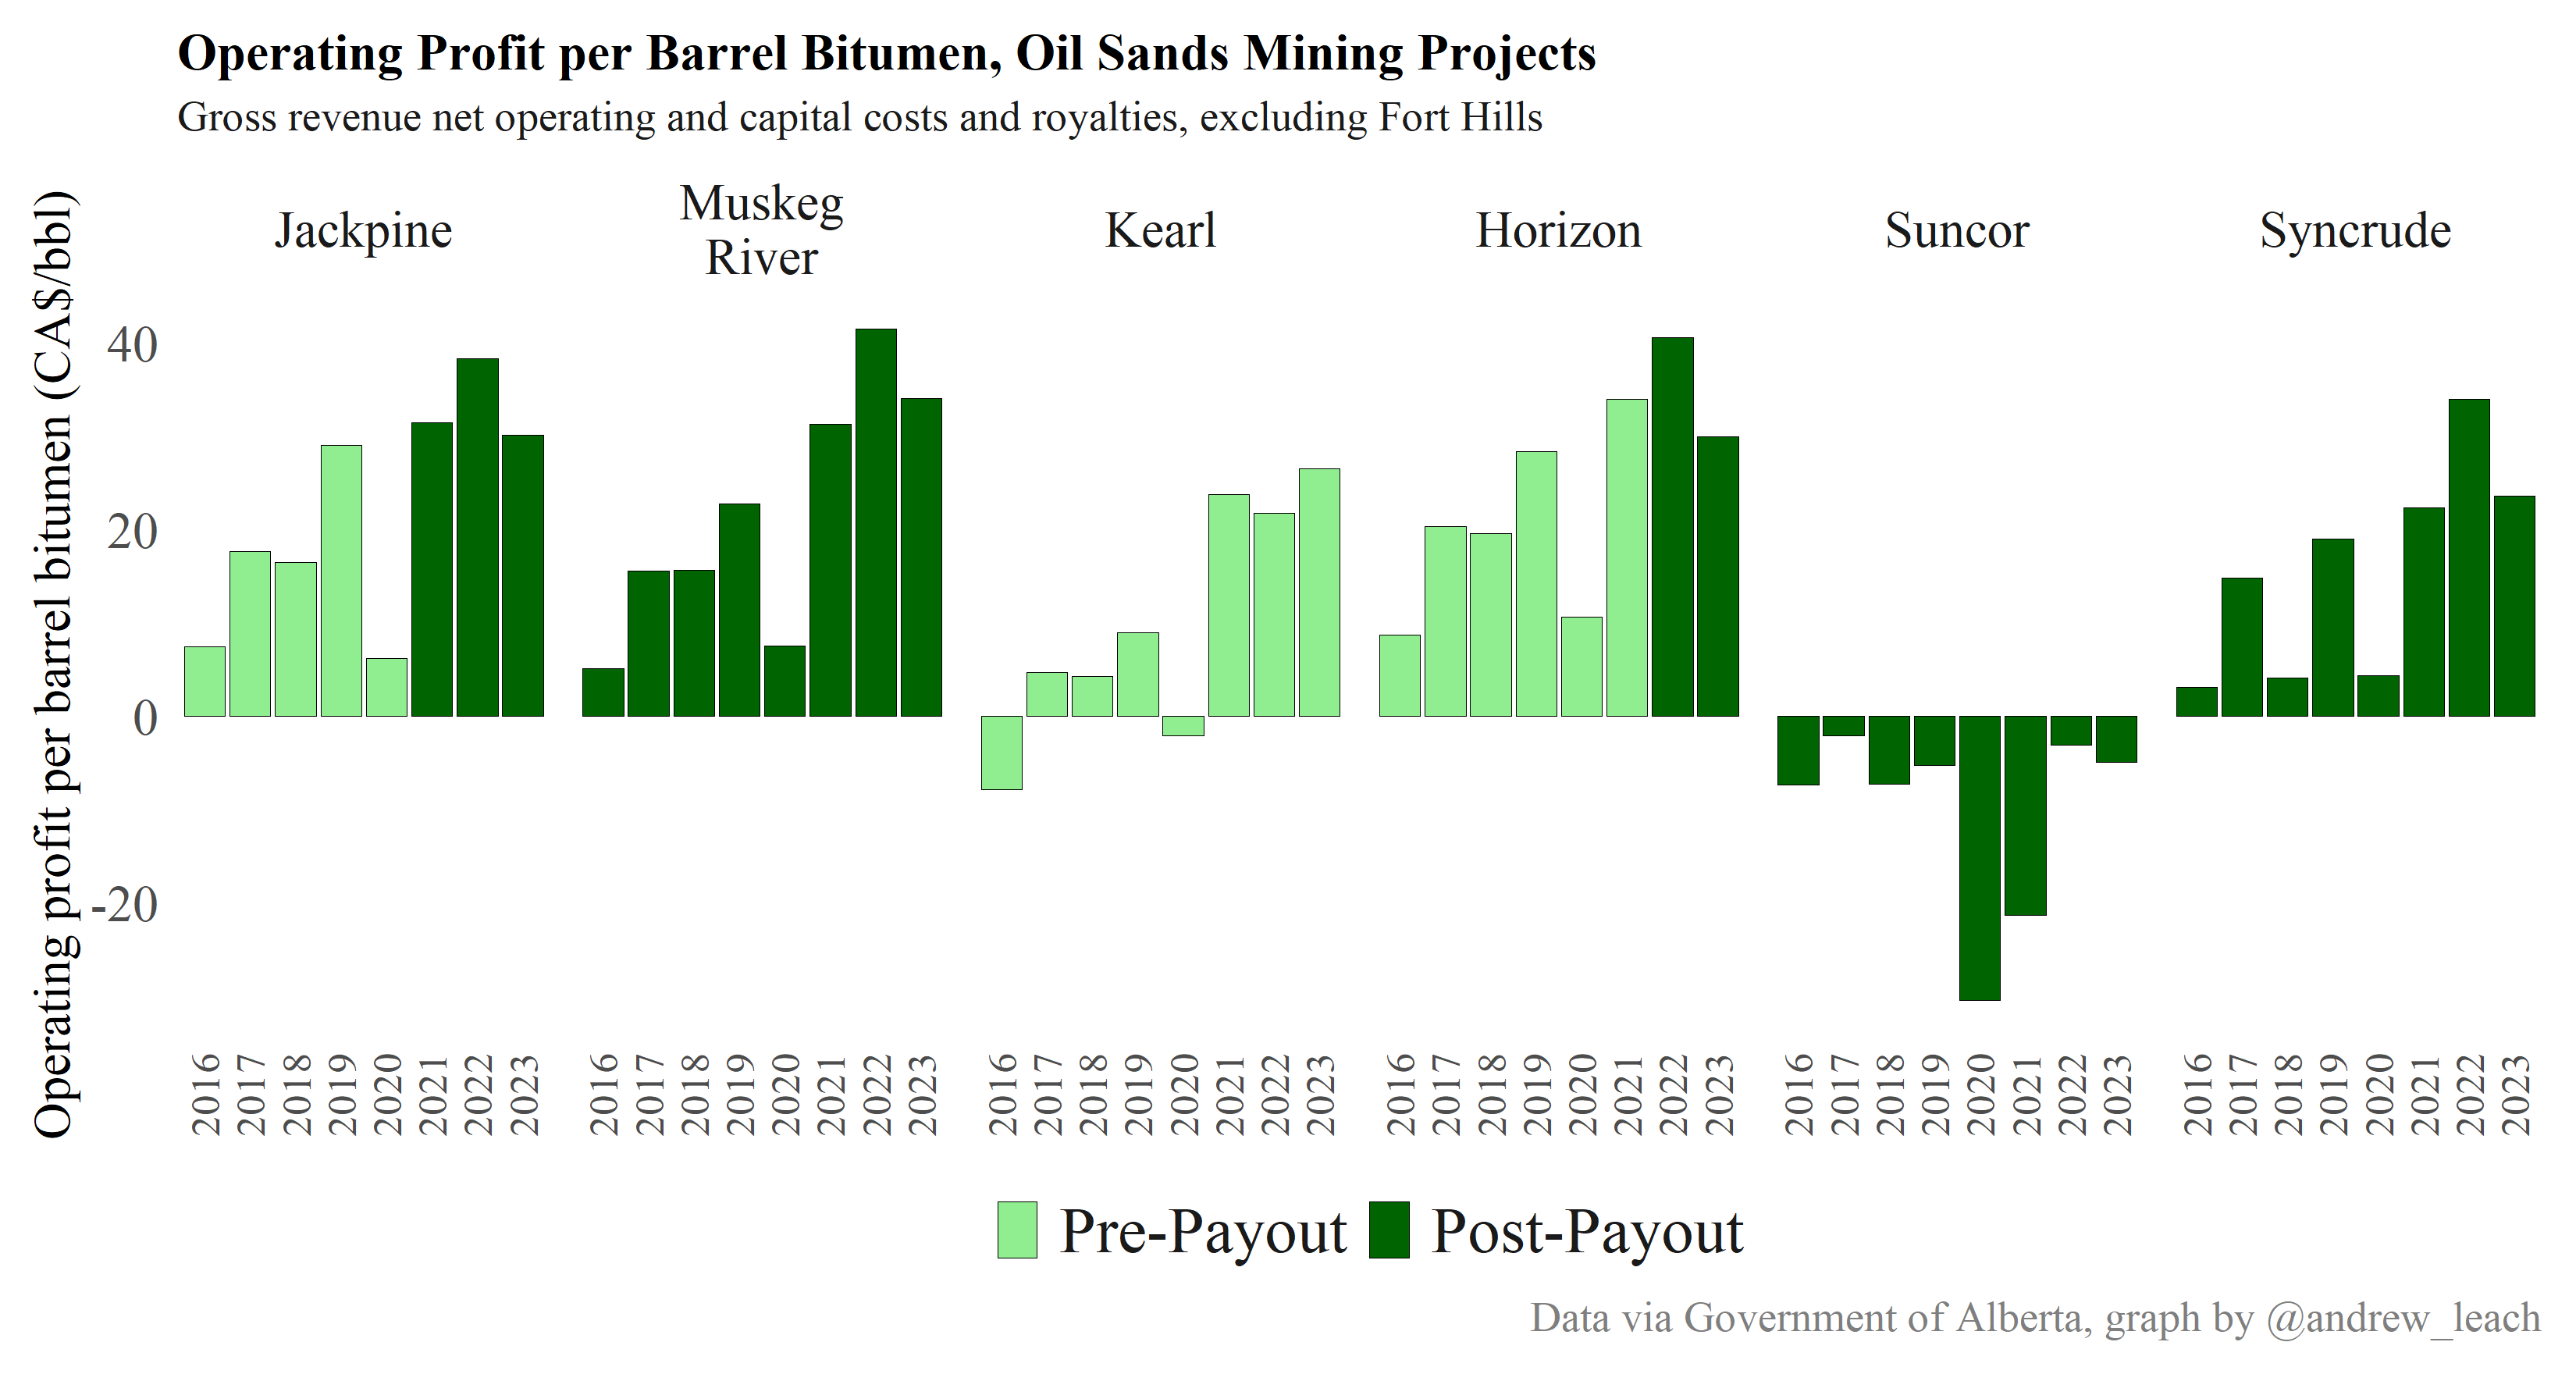
Mining Operating Profits (Post-Royalty)
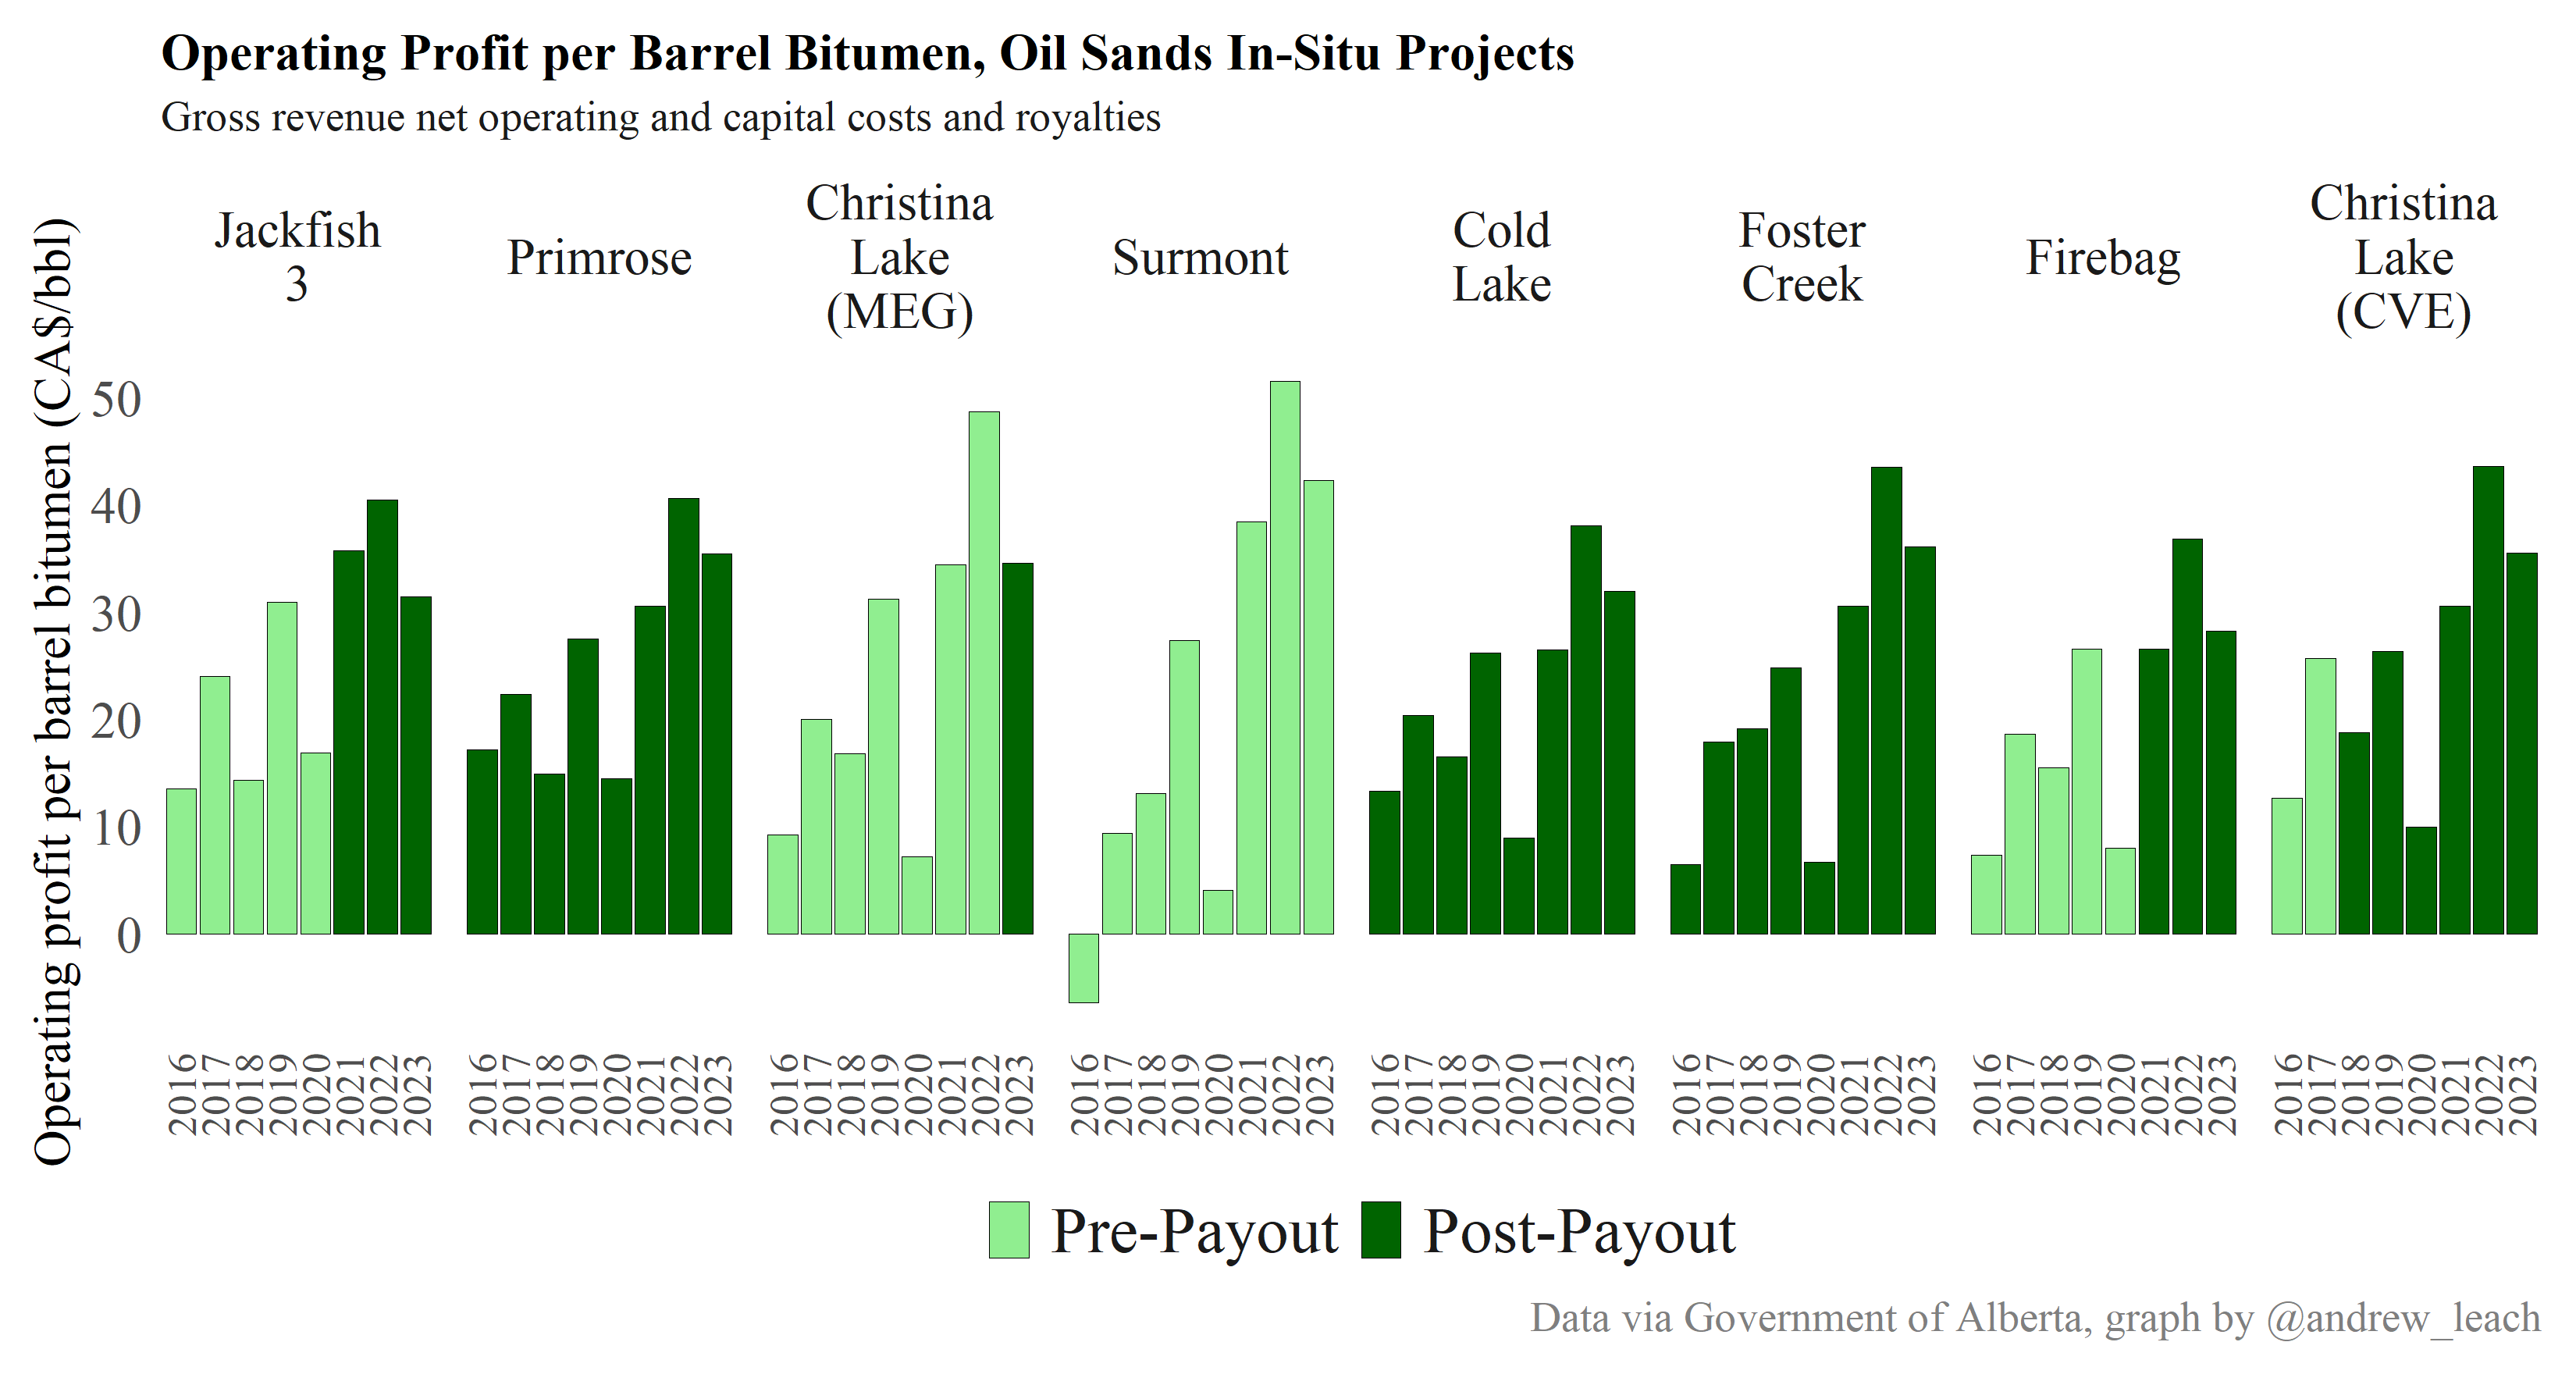
In Situ Operating Profits
Taxes
Main tax policies include
- Federal and provincial corporate taxes
- Capital cost allowance
- CDE and CEE
- Other issues affect junior oil and gas companies a lot more than oil sands firms
- e.g. flow-through shares and tax losses
We won't go into details on corporate taxes, but they are calculated in your model
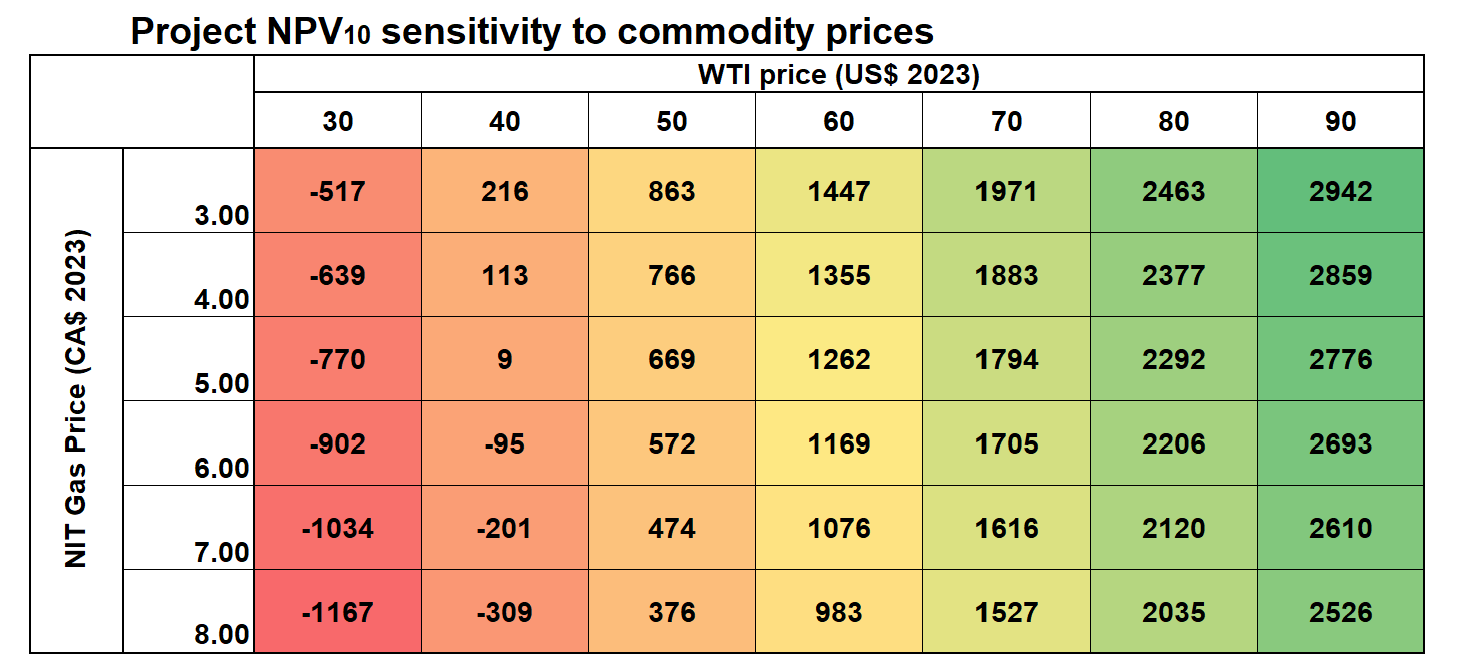
The inutition in the model: commodity prices
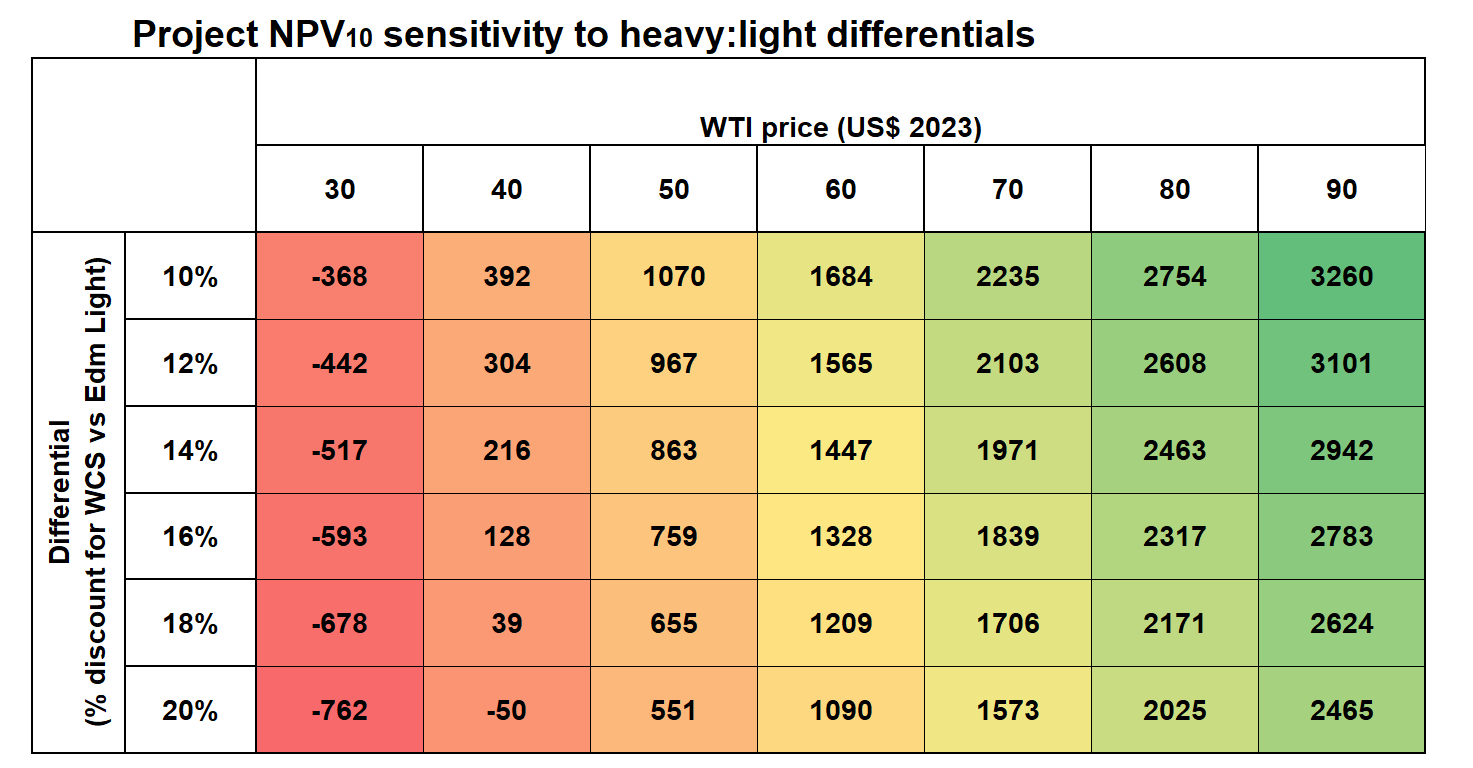
The inutition in the model: differentials
Supply cost basics
- the particular project in the model I've given you has a supply cost of about $40/bbl WTI
- supply costs will vary (all else equal) with:
- heavy oil differential (+, higher diff means higher WTI price needed)
- CAD (+, stronger CAD (fewer CAD per USD) means higher WTI price needed)
- gas prices (+, higher gas price means higher WTI price needed)
- capital costs (+, higher Capital cost means higher WTI price needed)
- operating costs (+, higher op costs means higher WTI price needed)
- taxes and royalties (+, higher taxes mean higher WTI price needed)
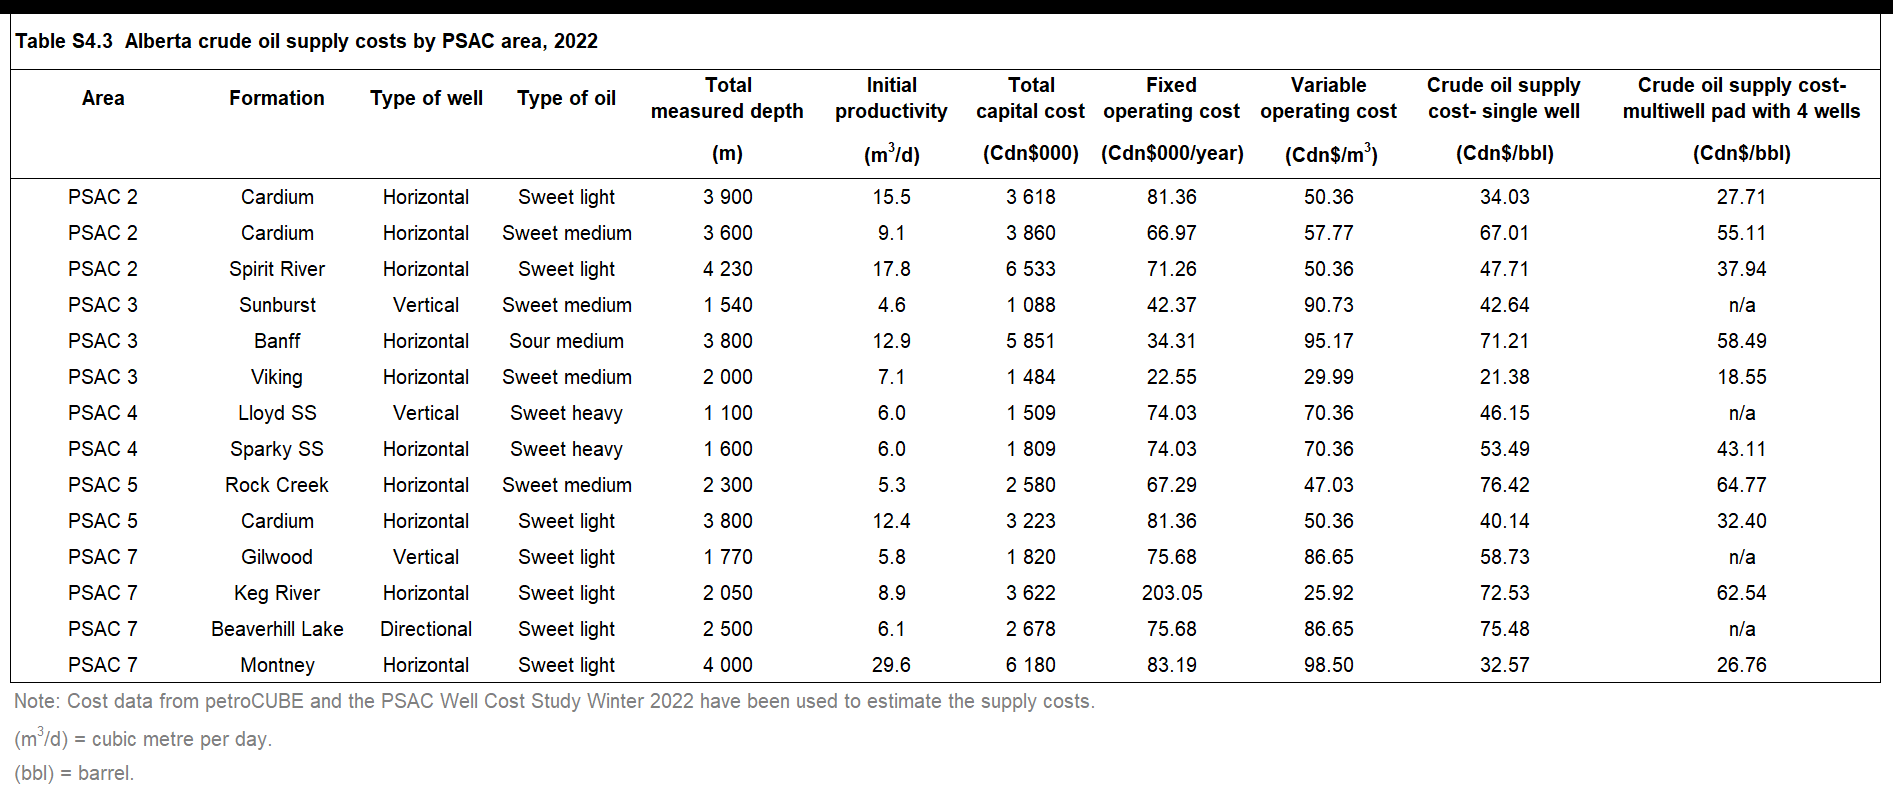
Supply Costs in Practice

Supply Costs in Practice
Key concept review
- Netback bitumen pricing
- Royalty regimes for oil sands and non-oil sands extraction in Alberta
