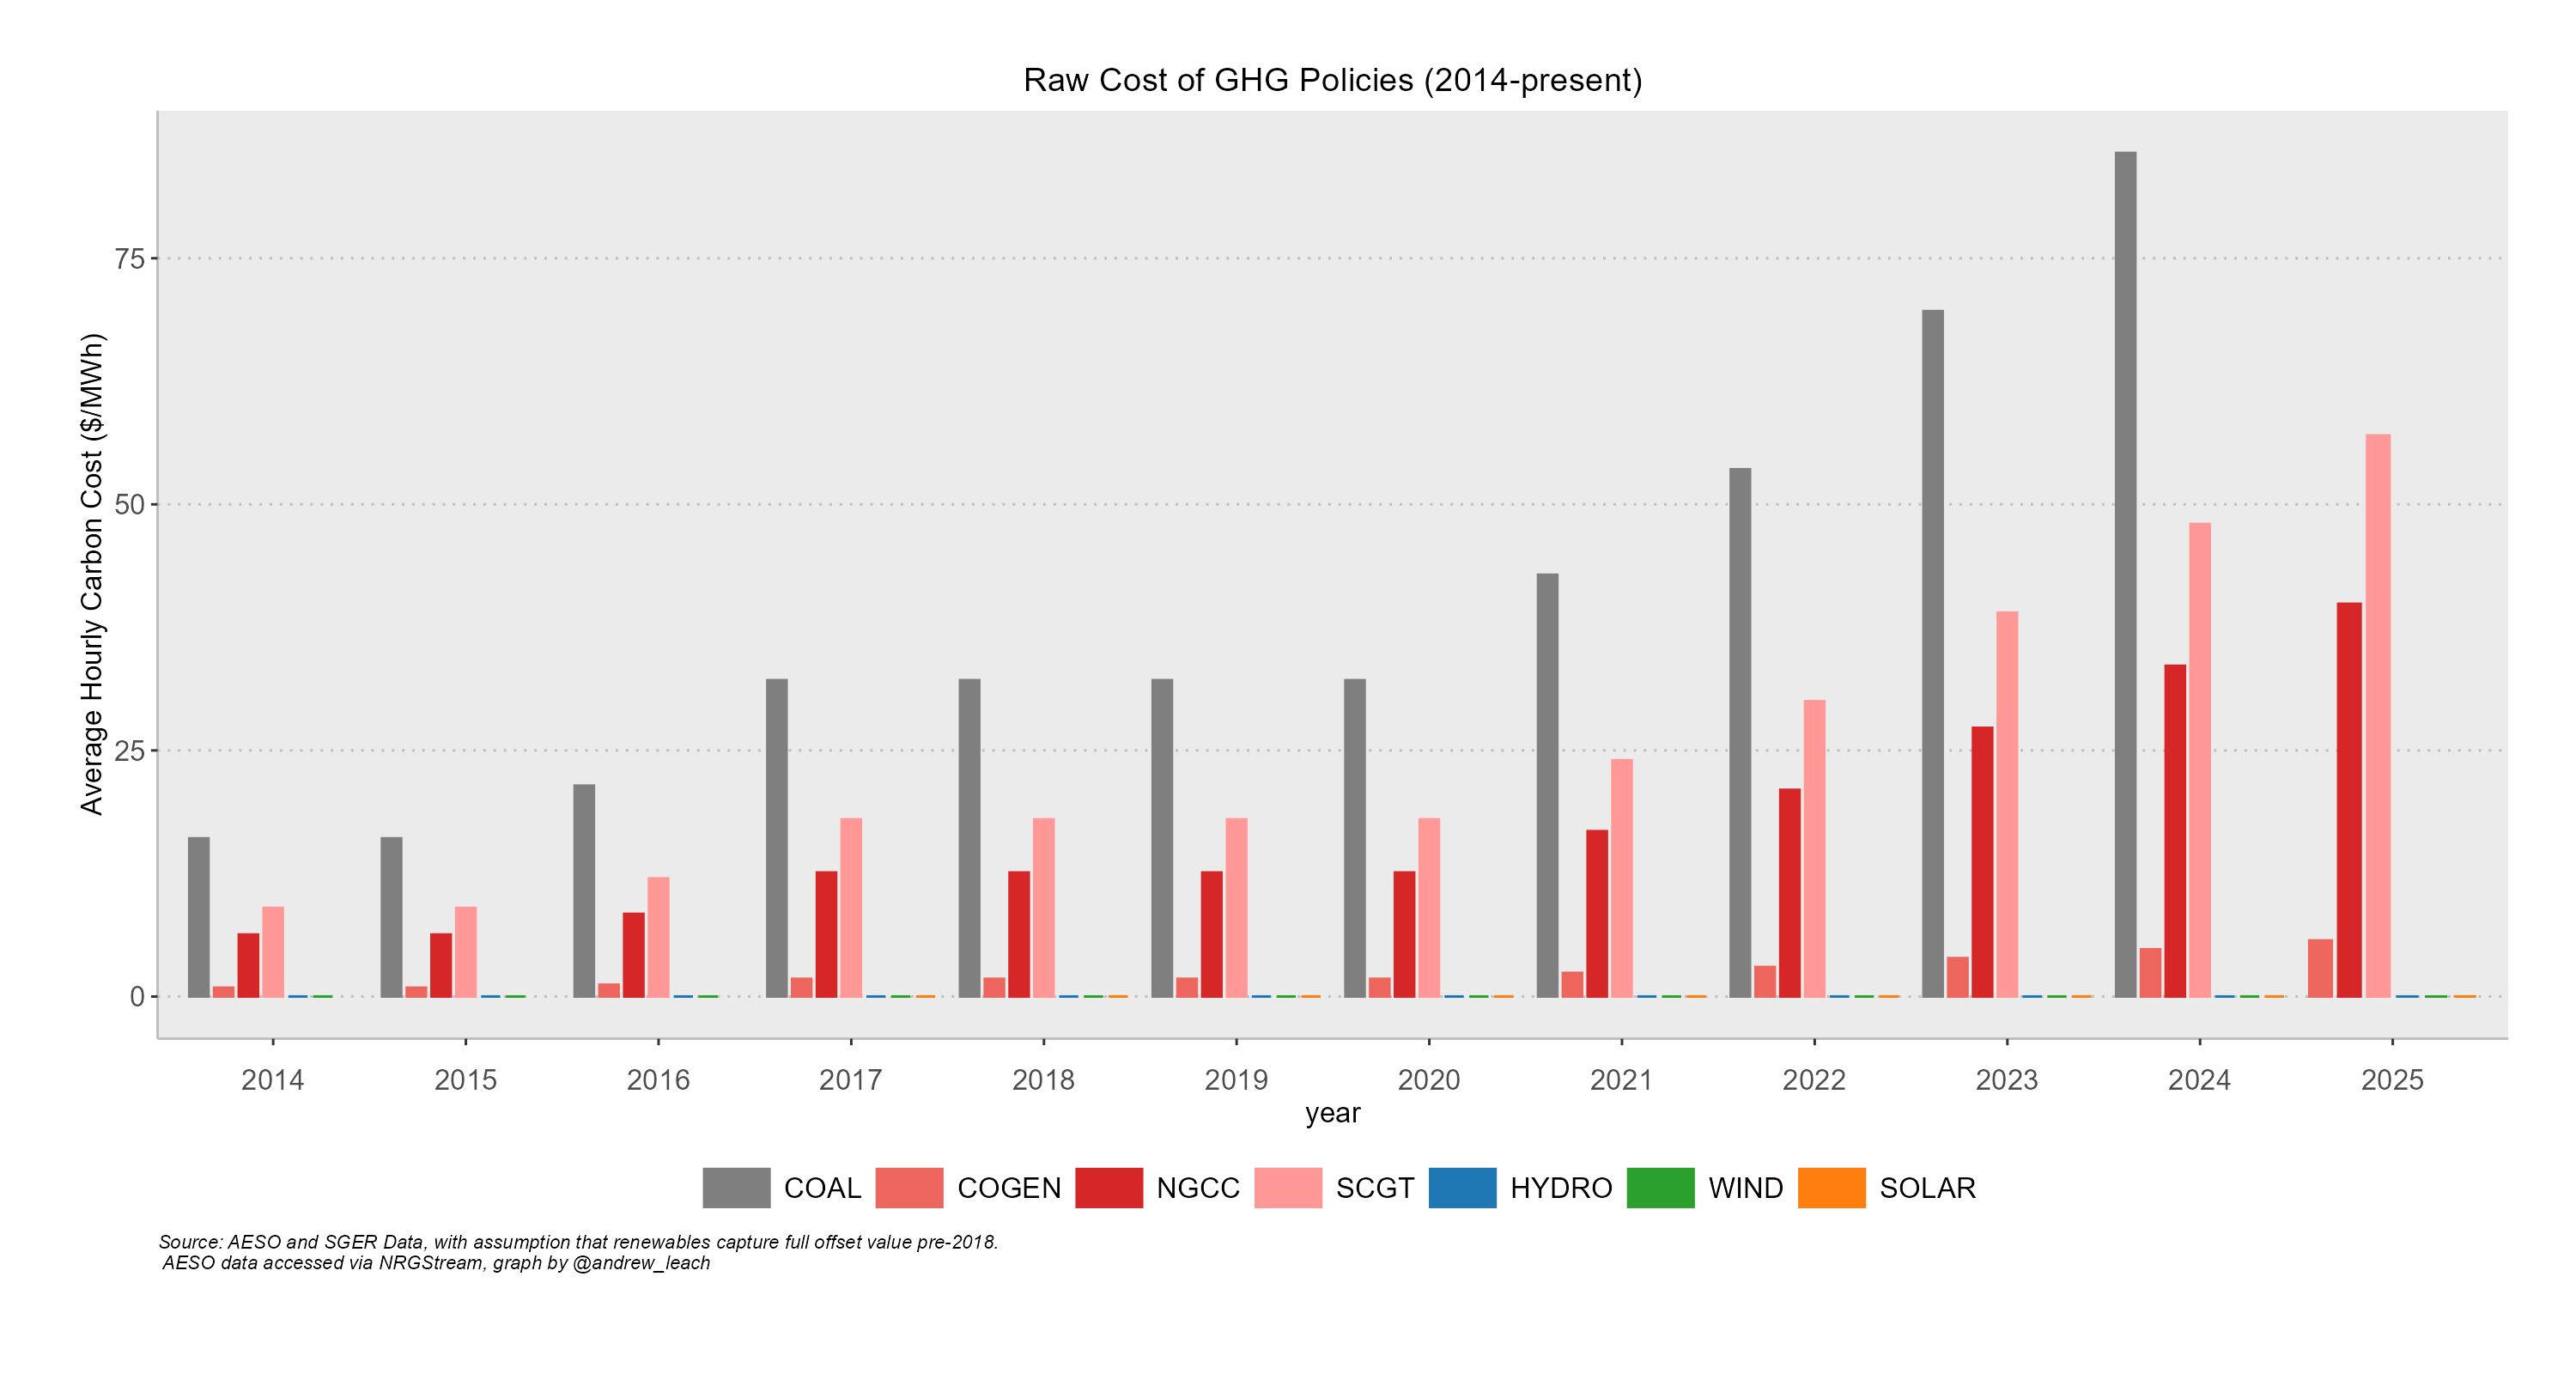
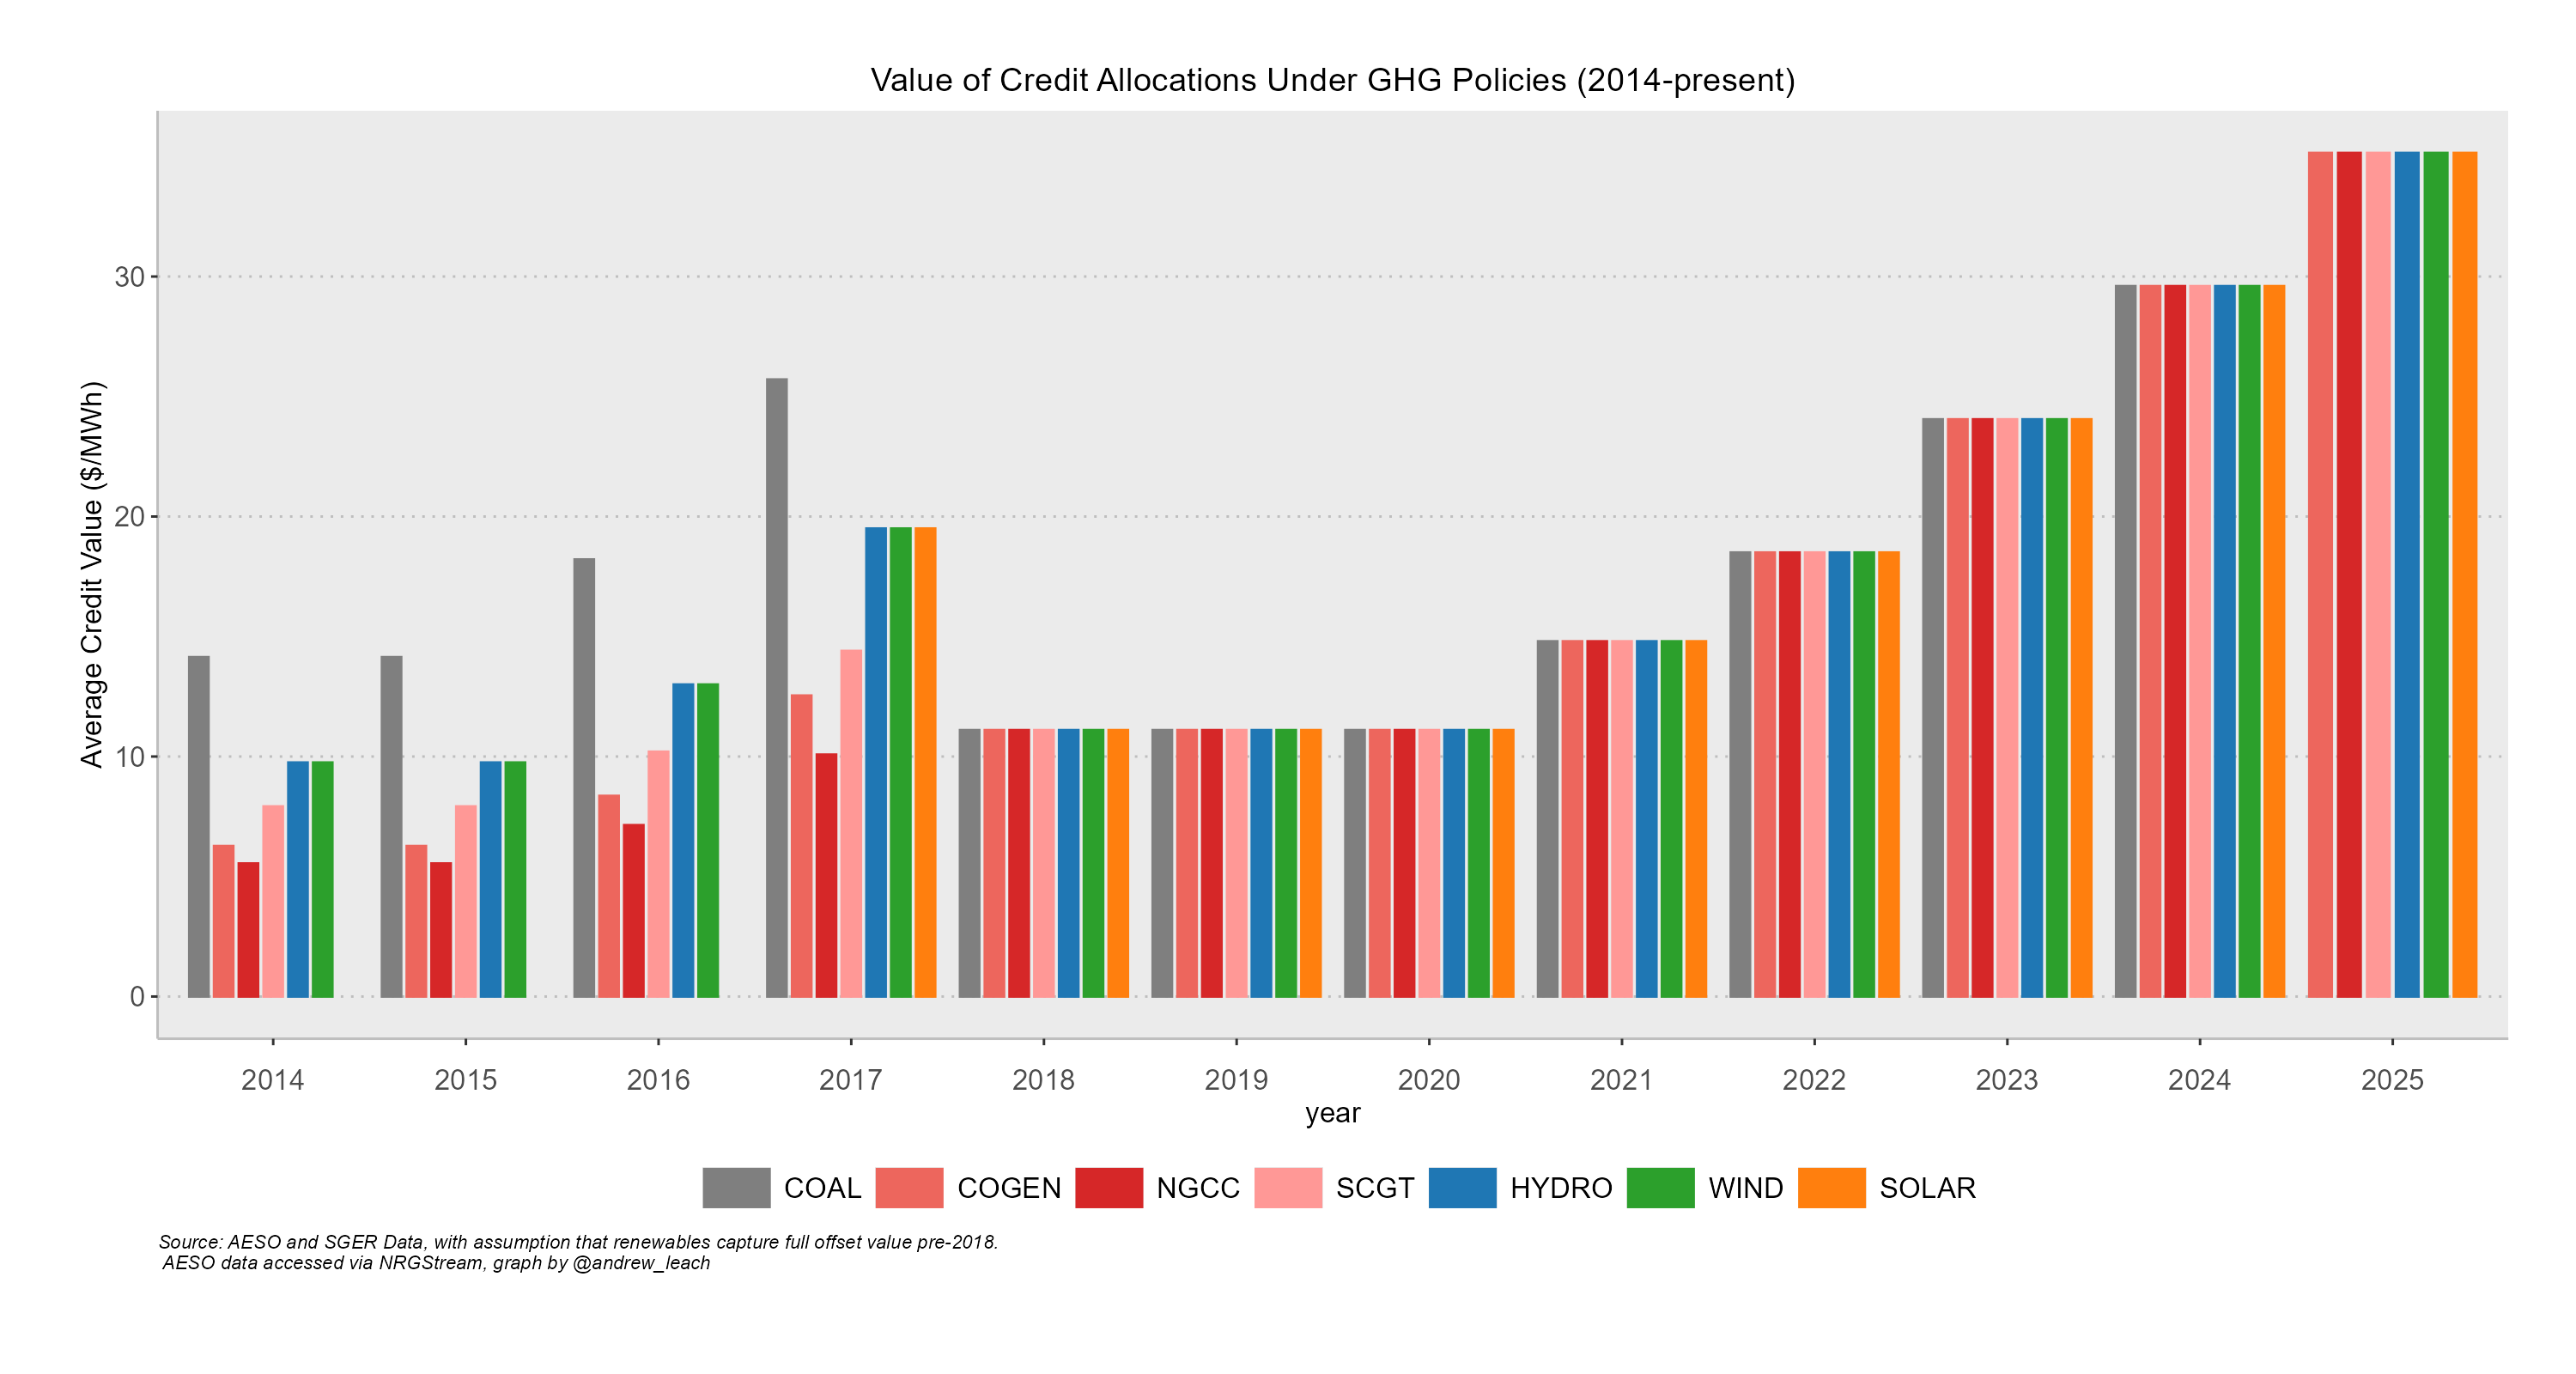
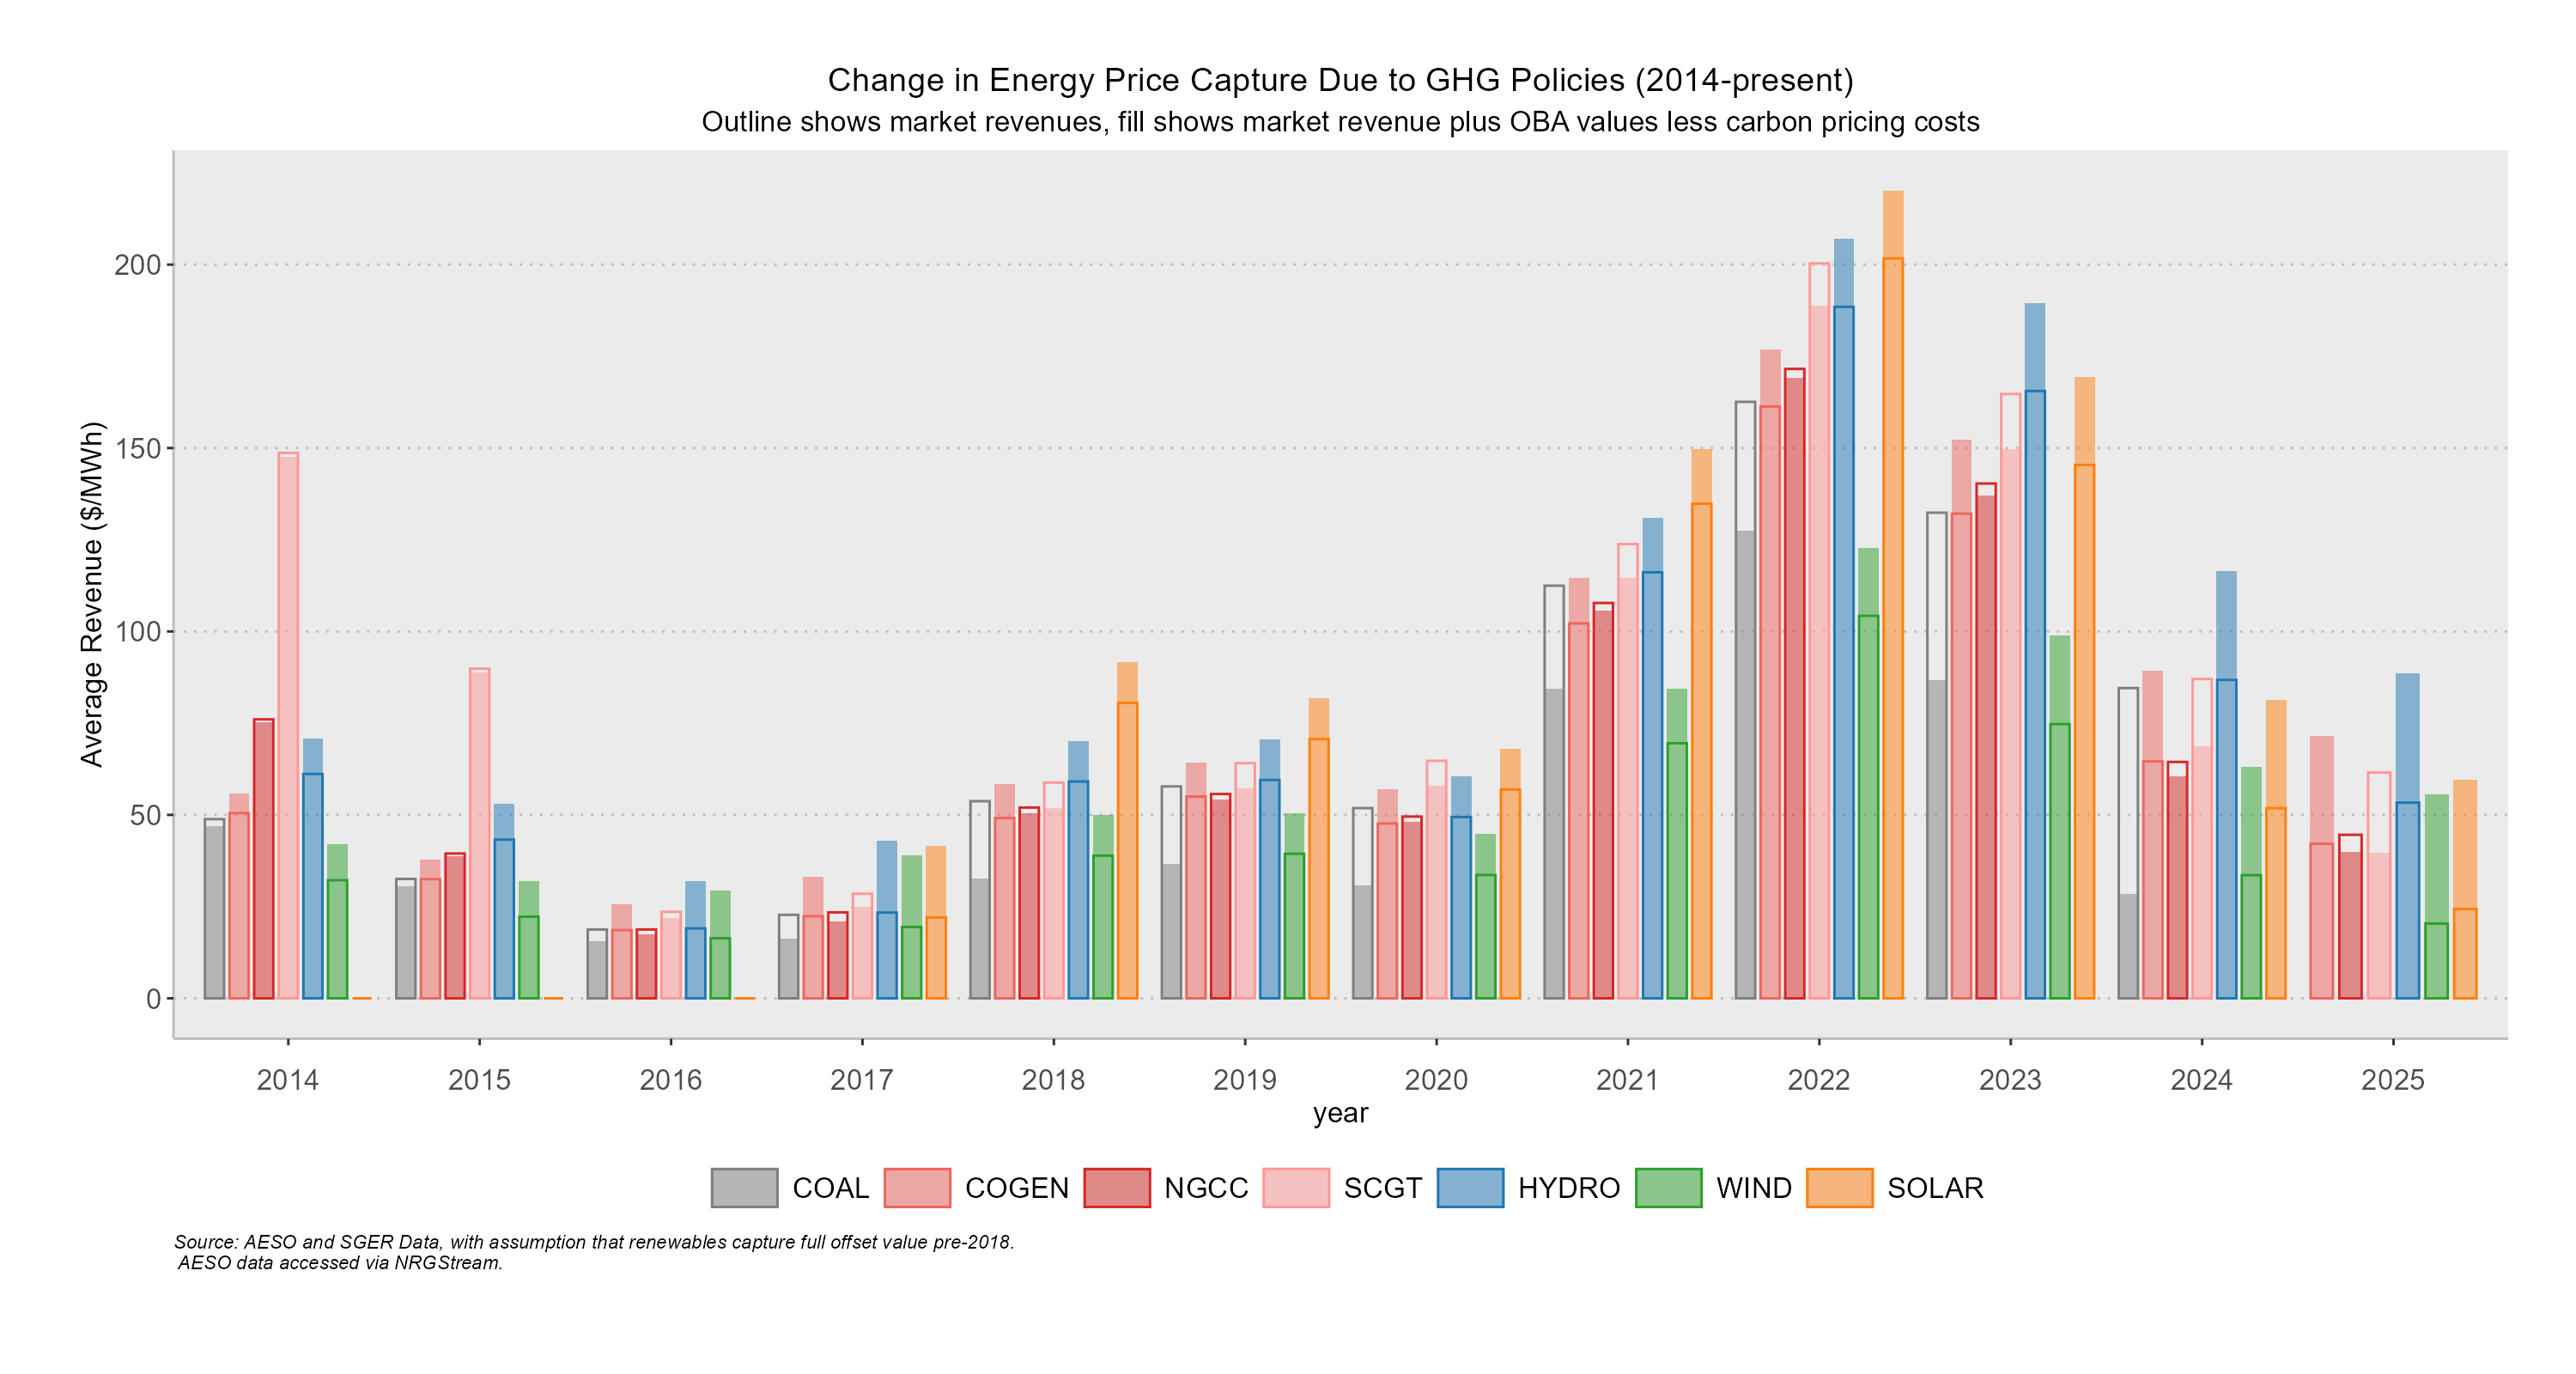
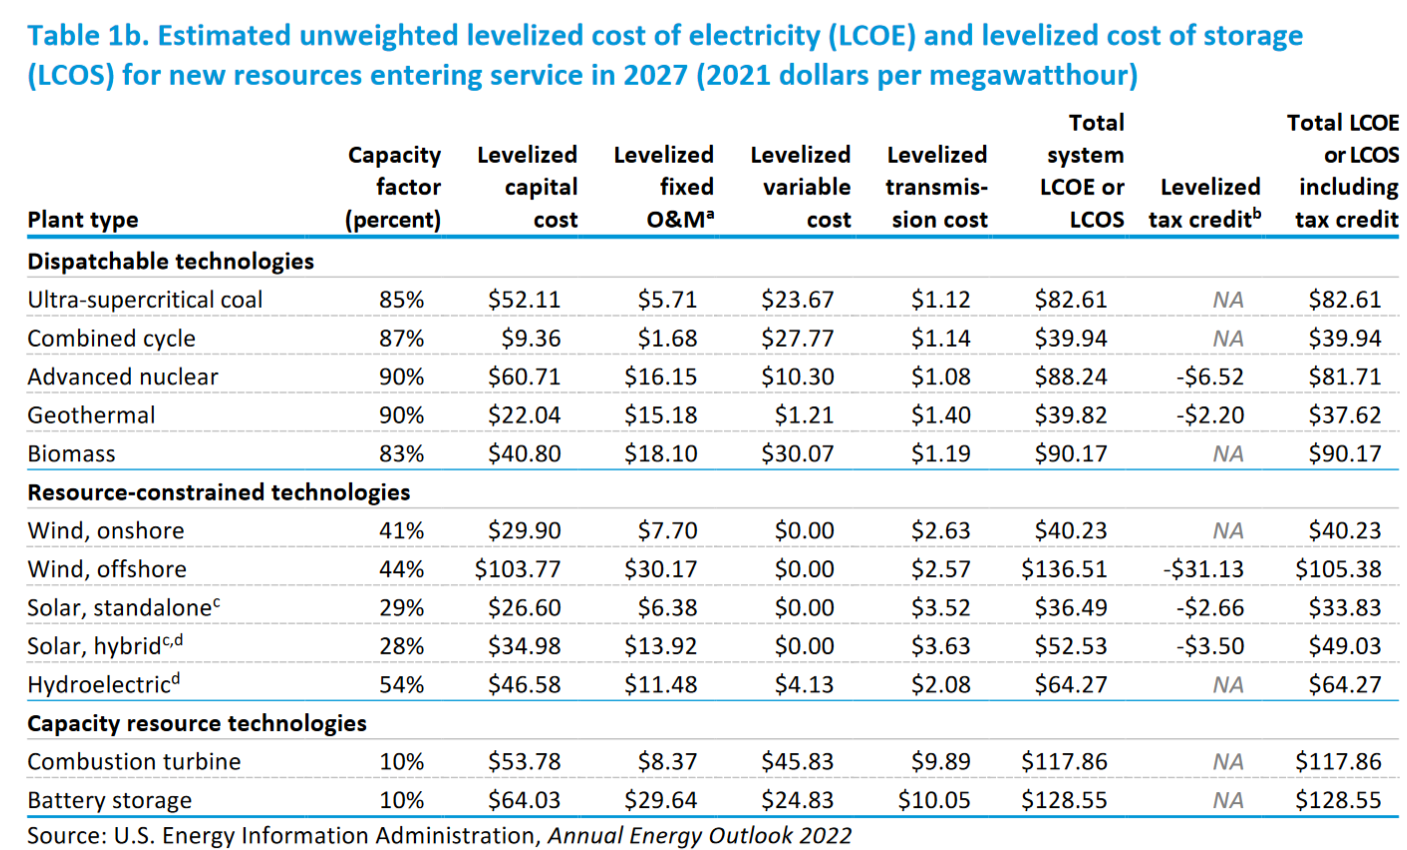
class: center, middle, inverse, title-slide .title[ # ECON 366: Energy Economics ] .subtitle[ ## Topic 3.4: Electricity Generation ] .author[ ### Andrew Leach, Professor of Economics and Law ] .date[ ###
aleach@ualberta.ca
leachandrew
@andrew_leach
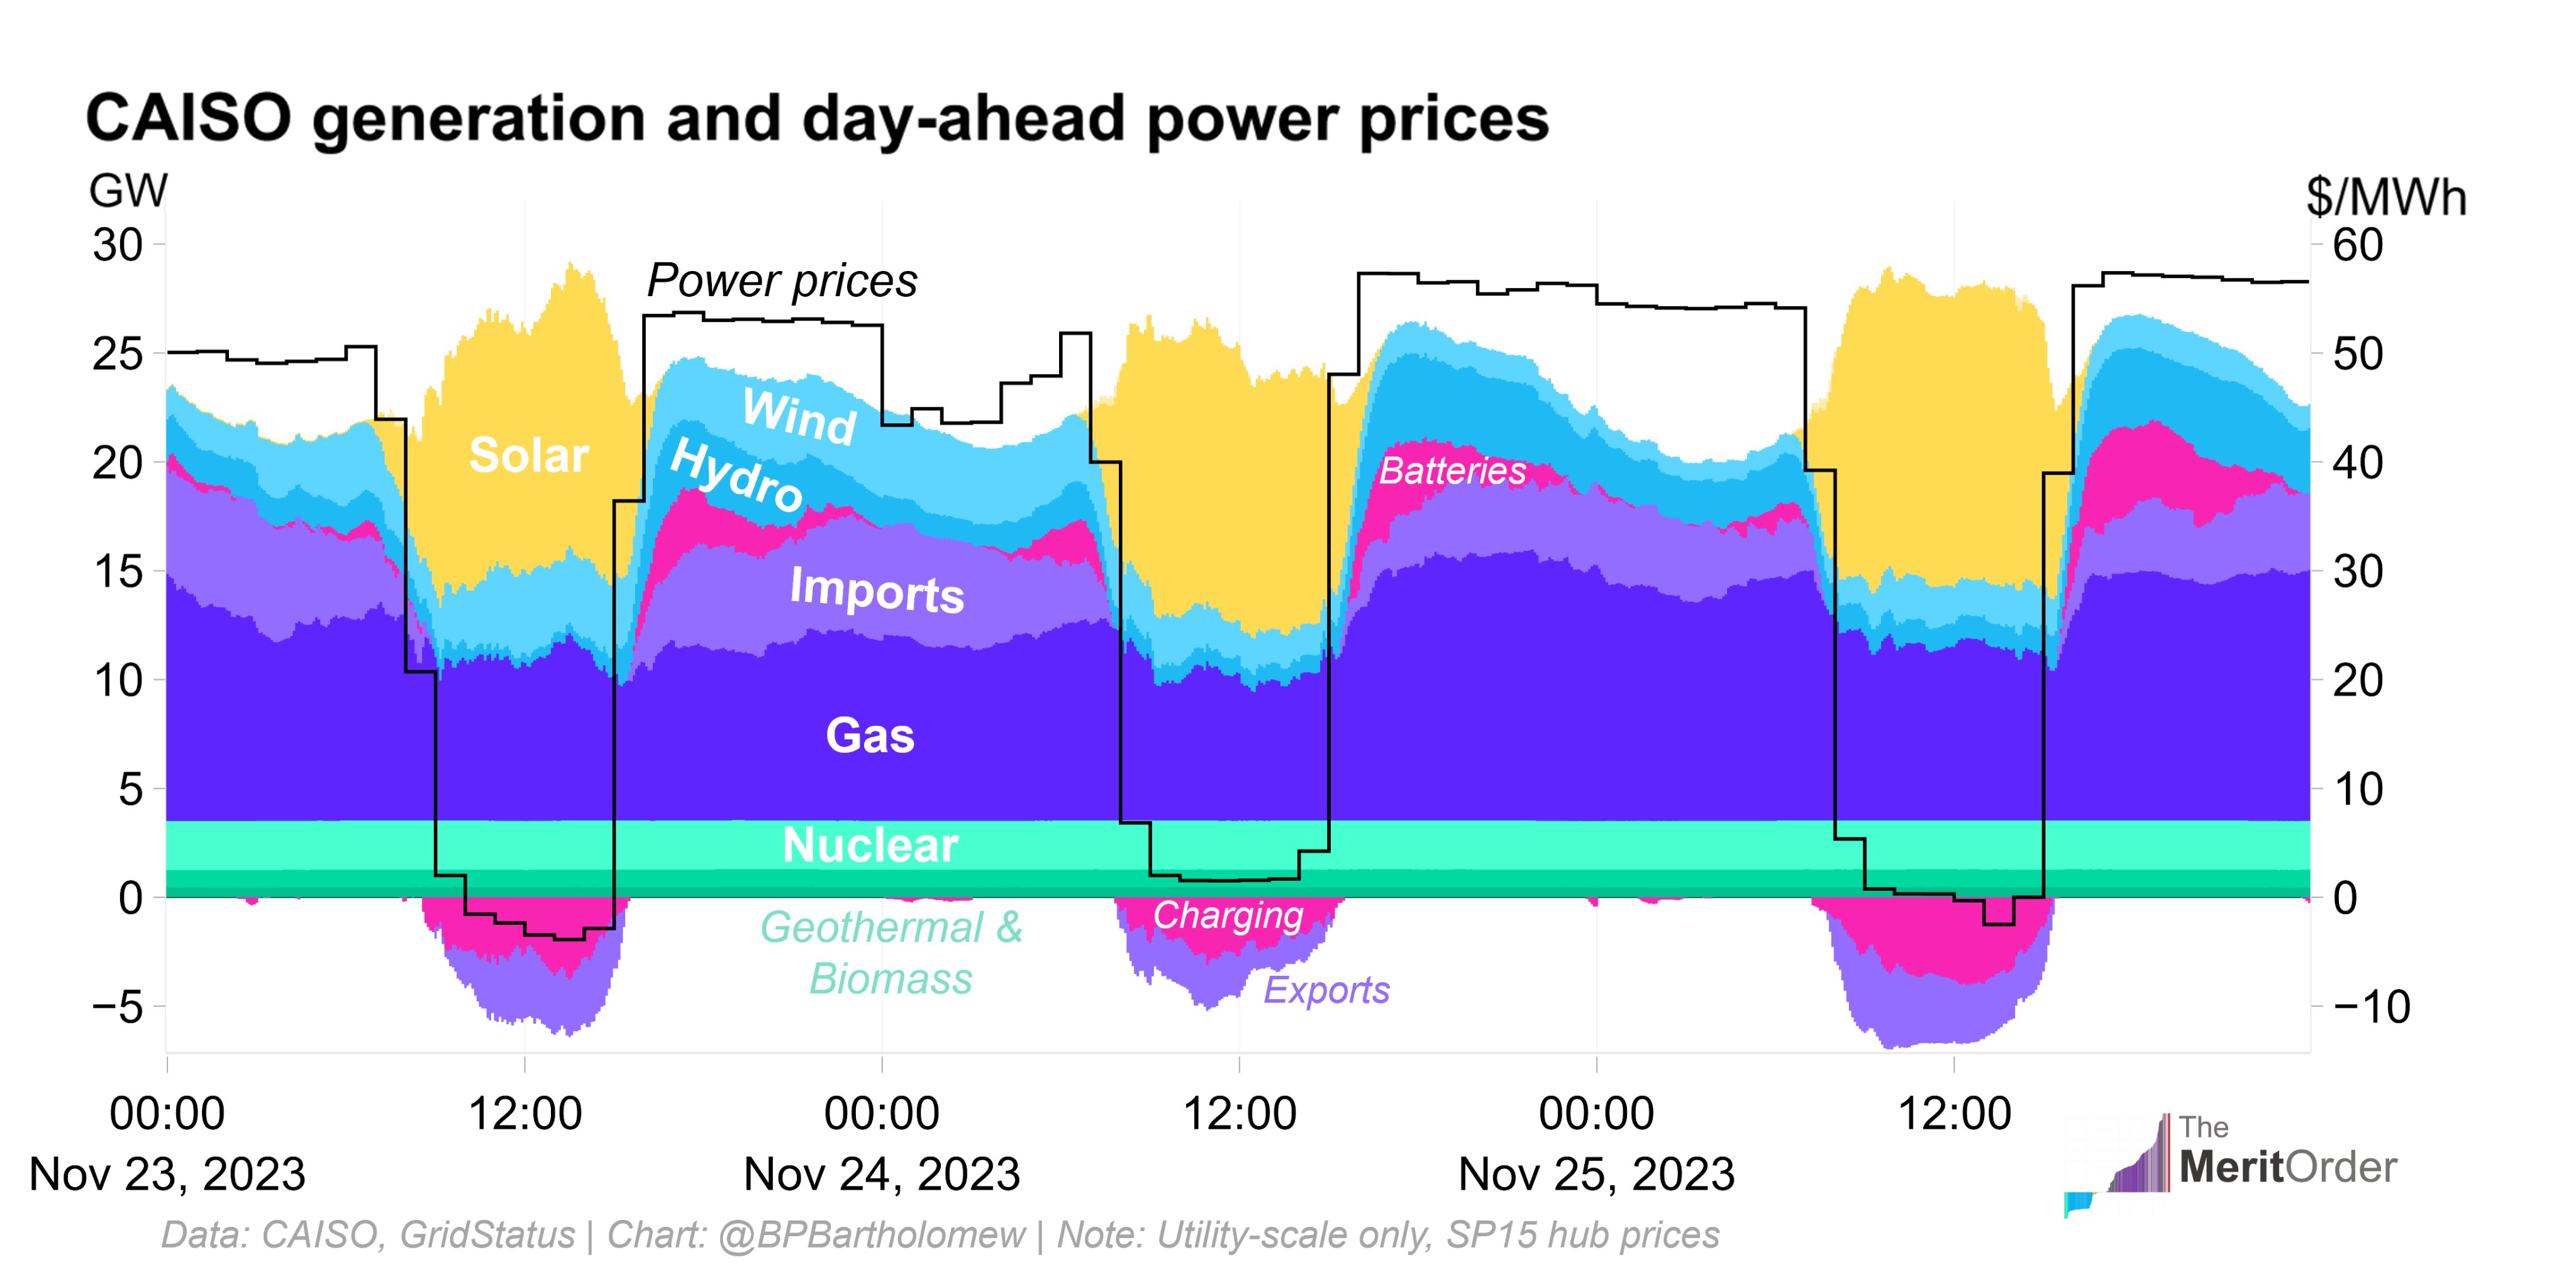
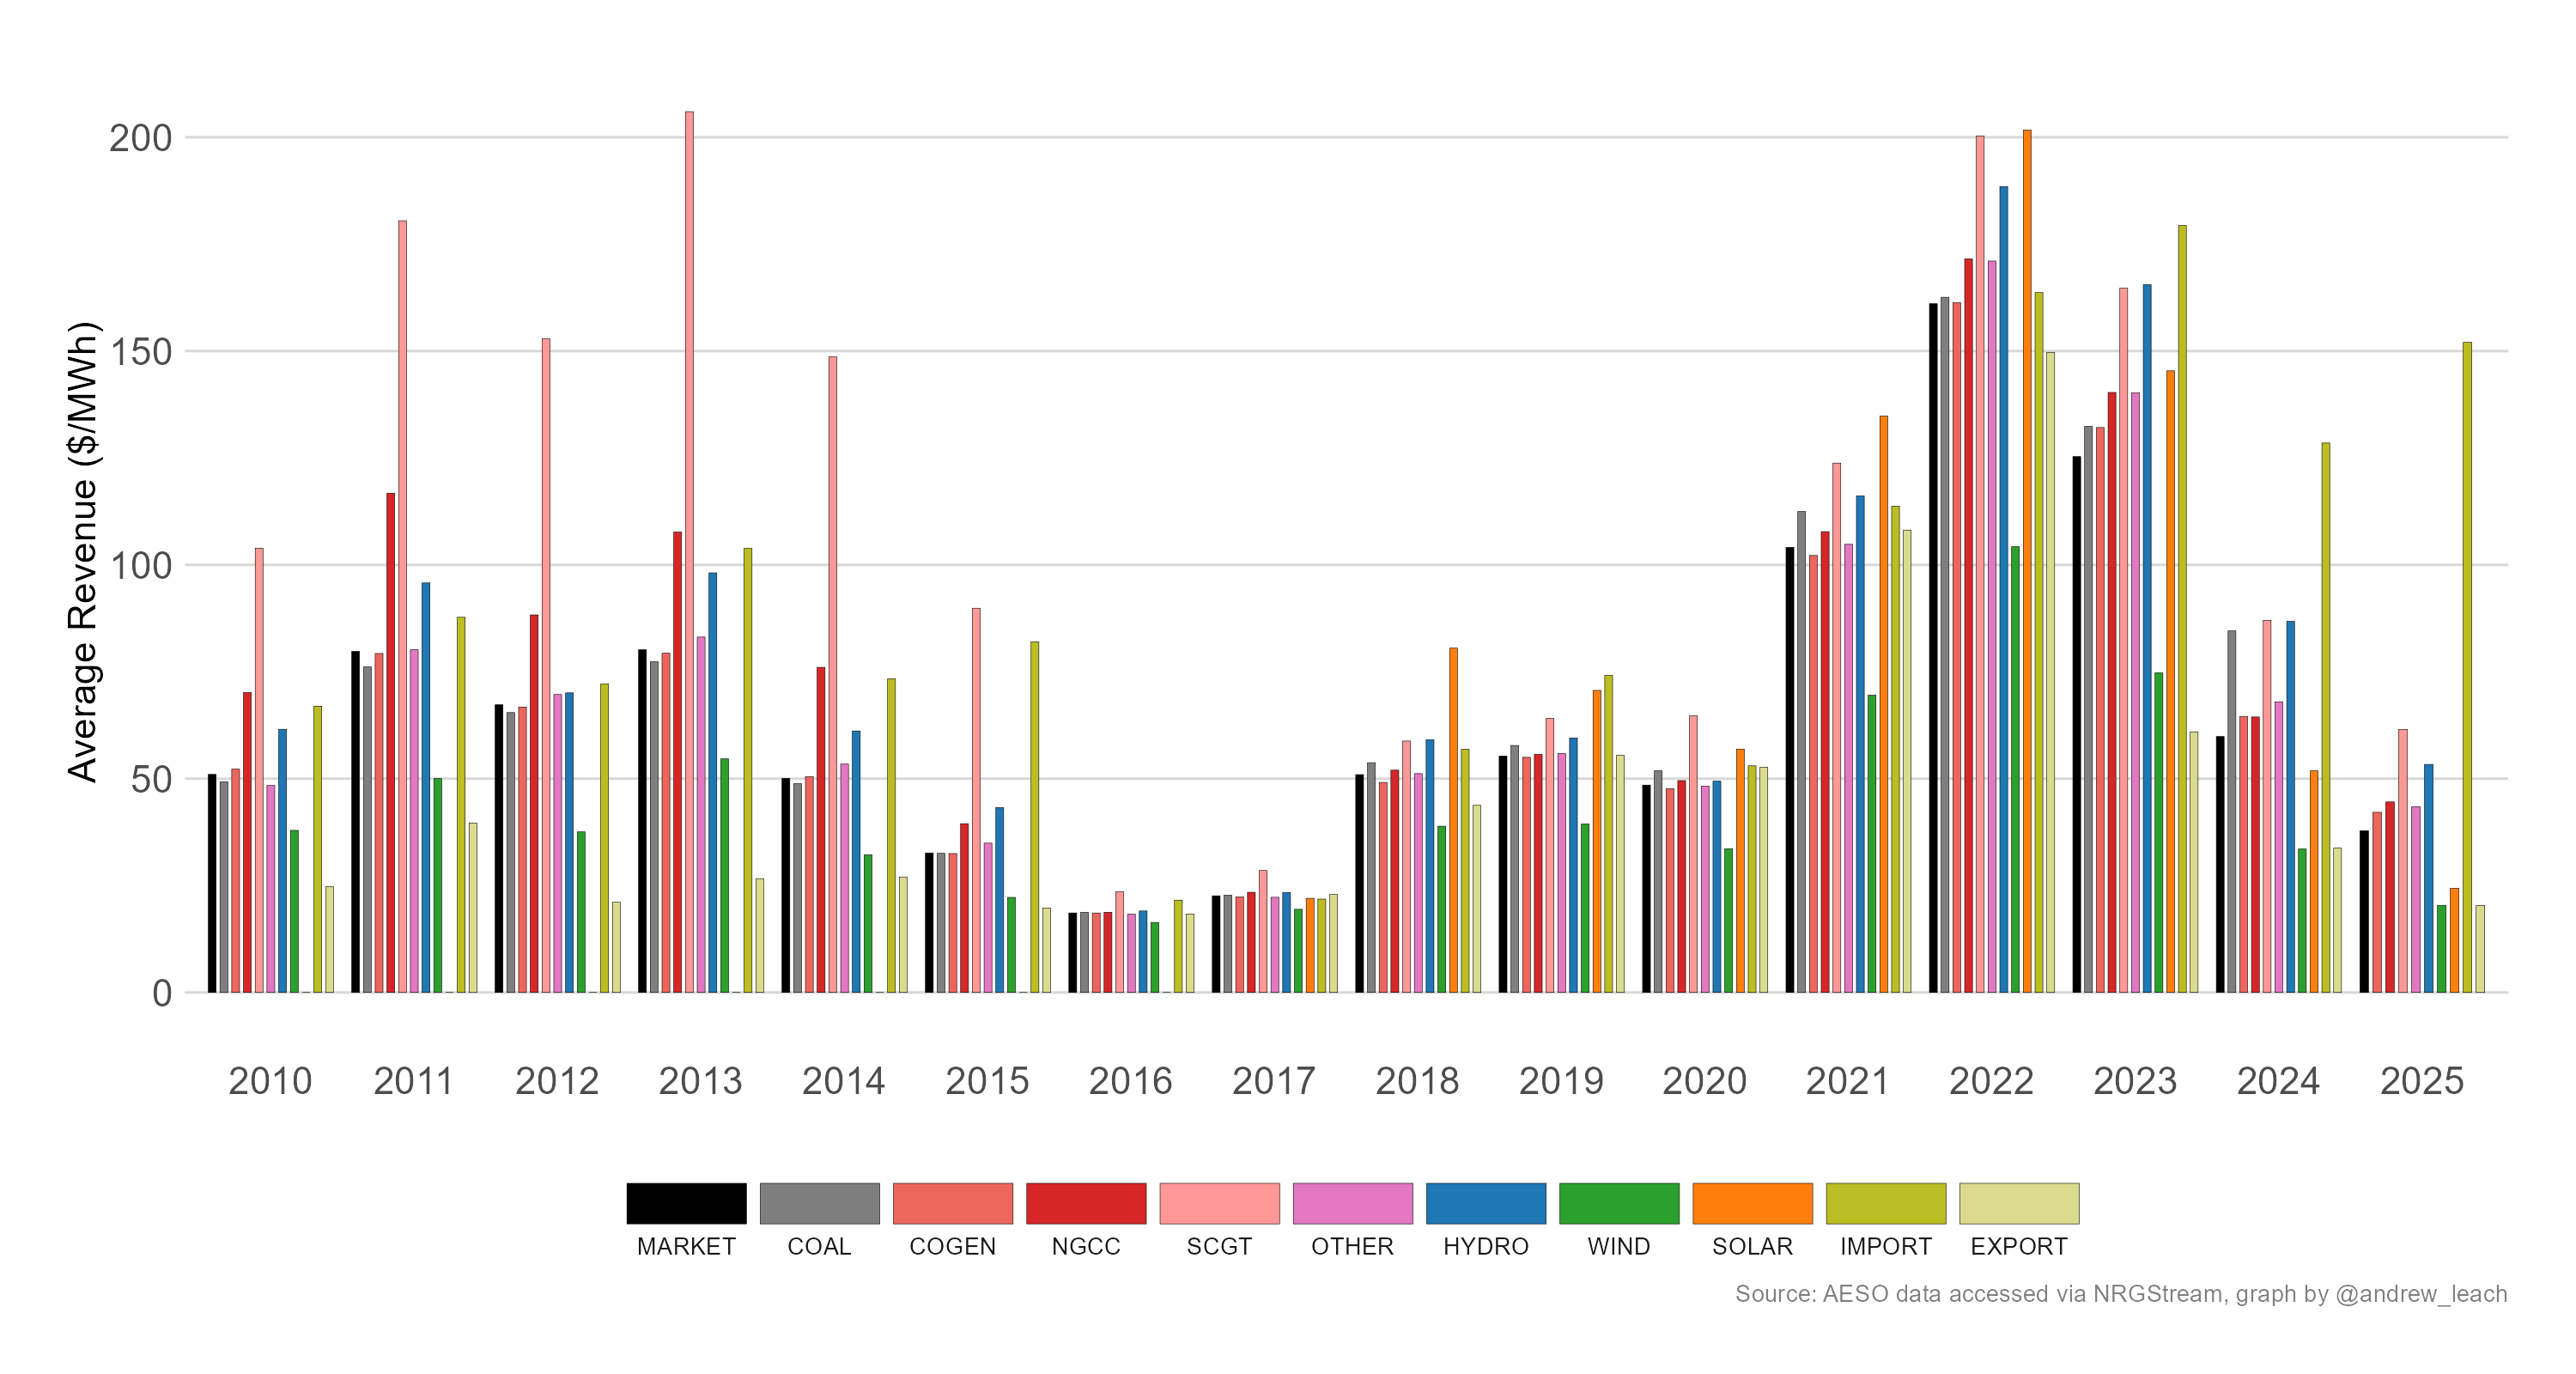
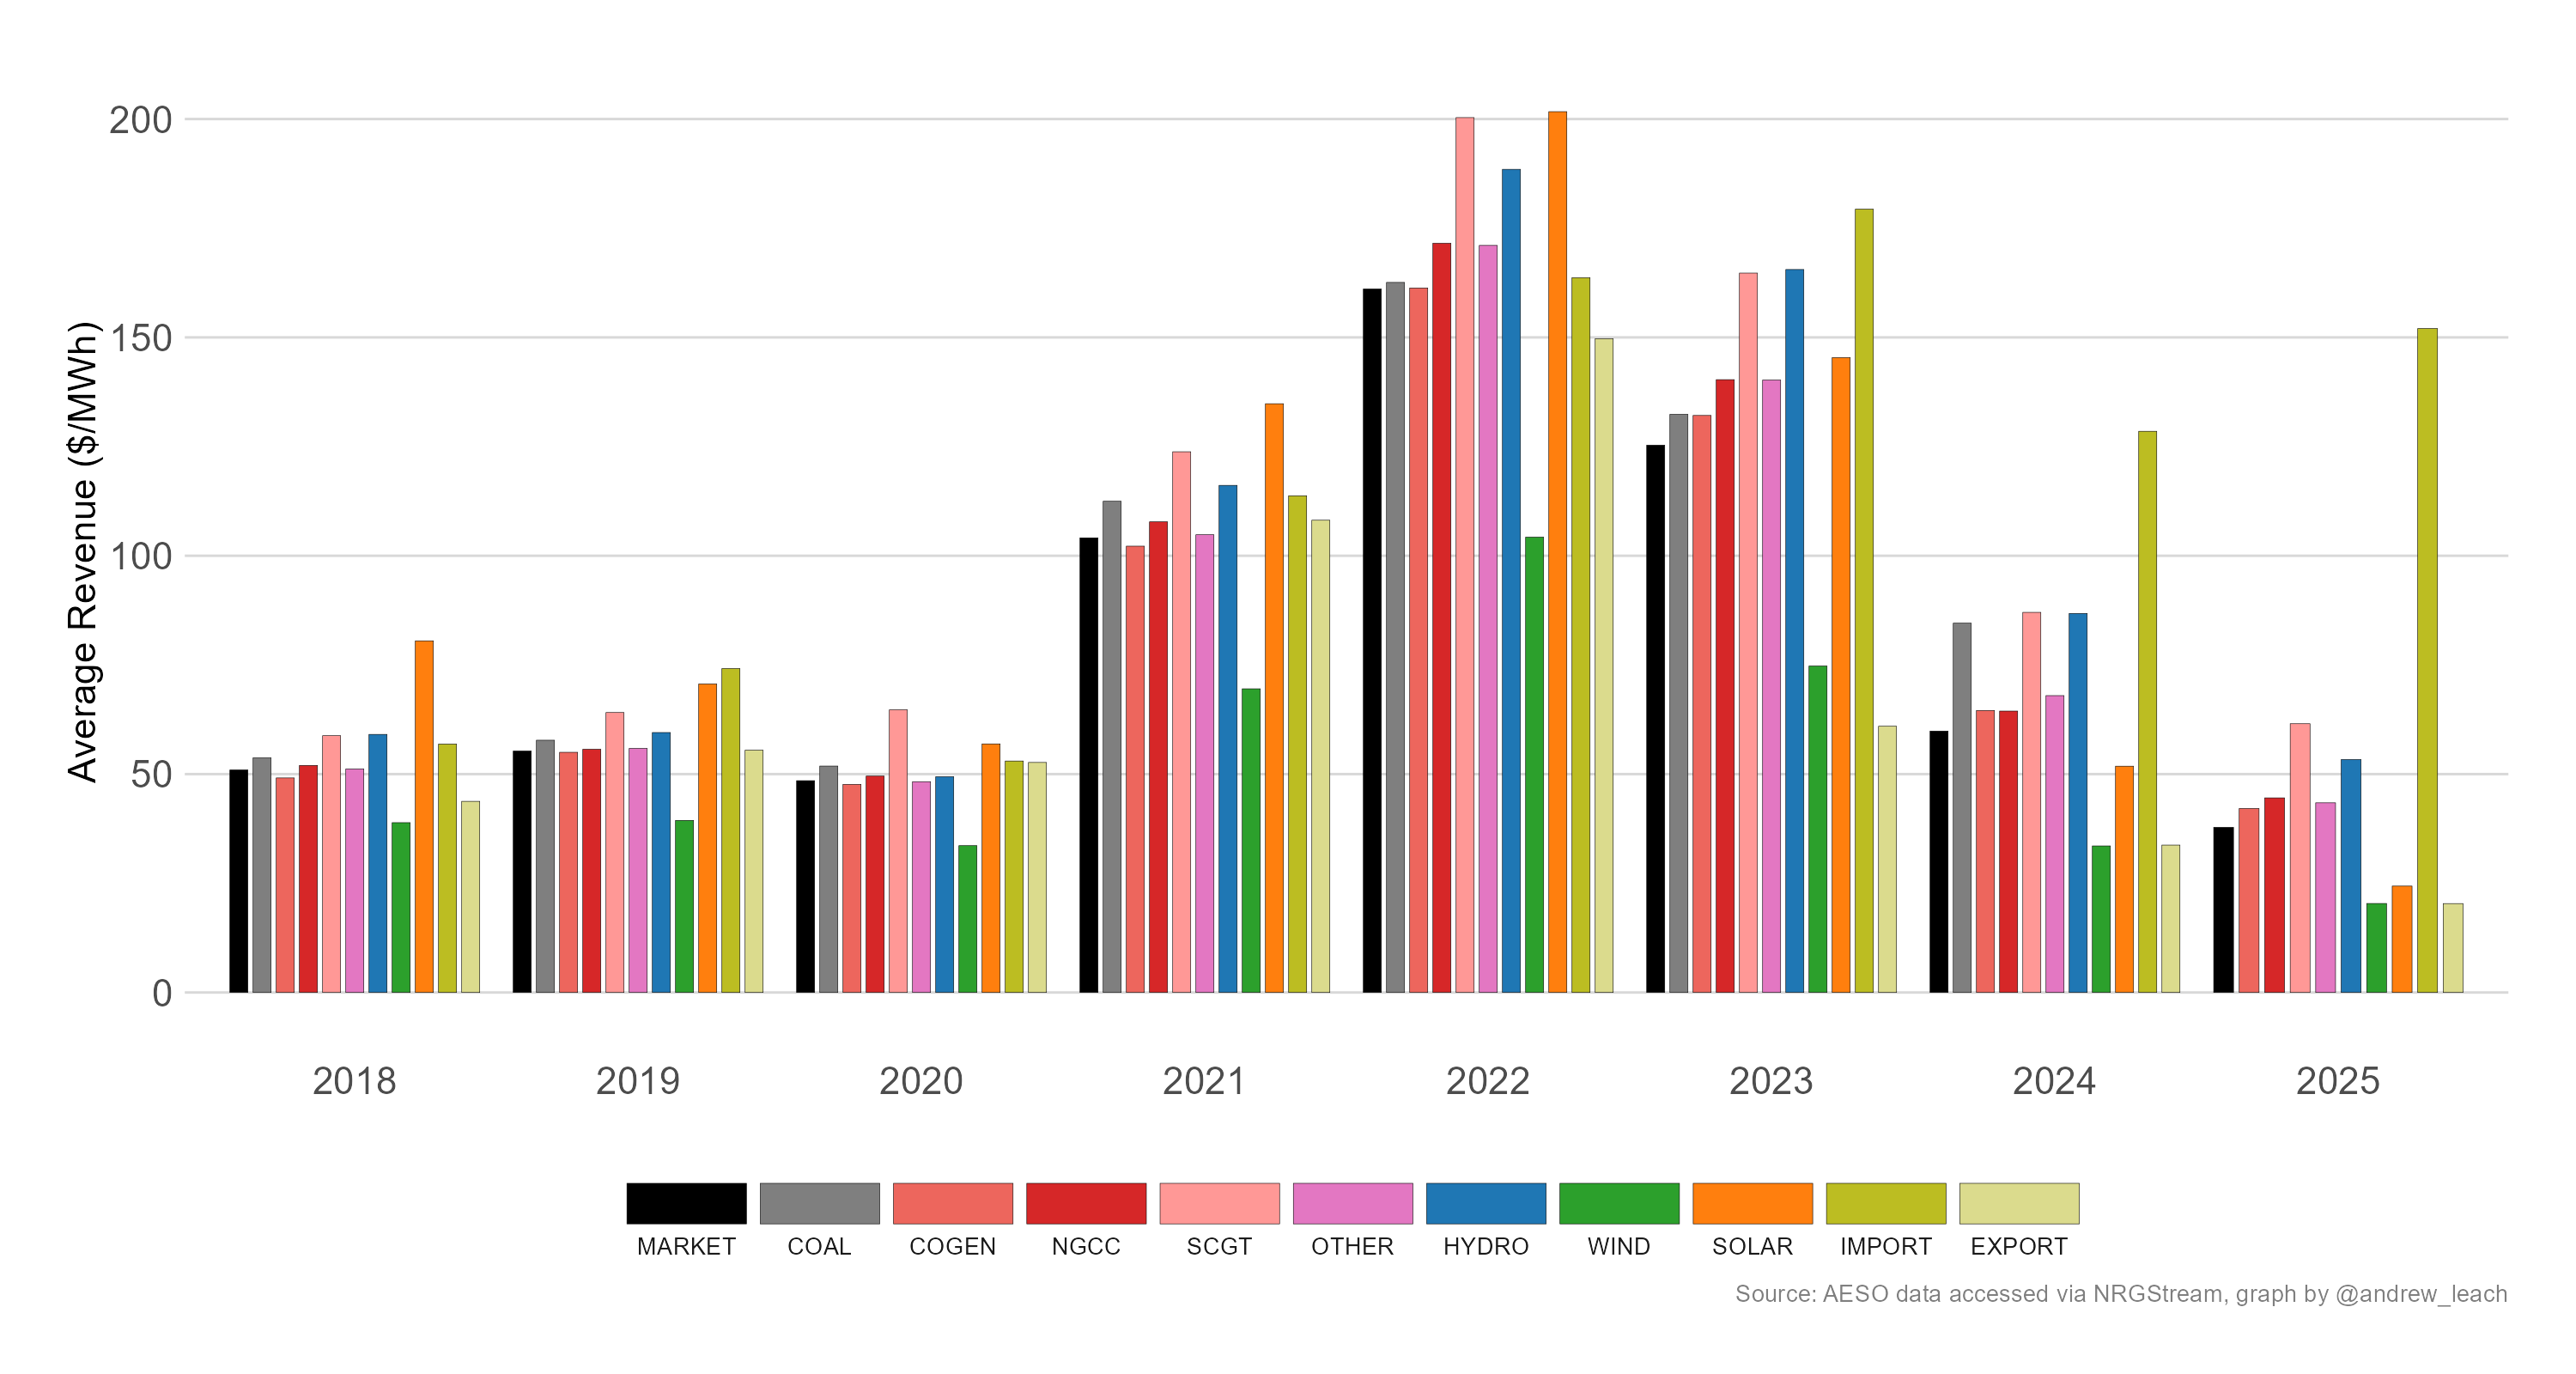
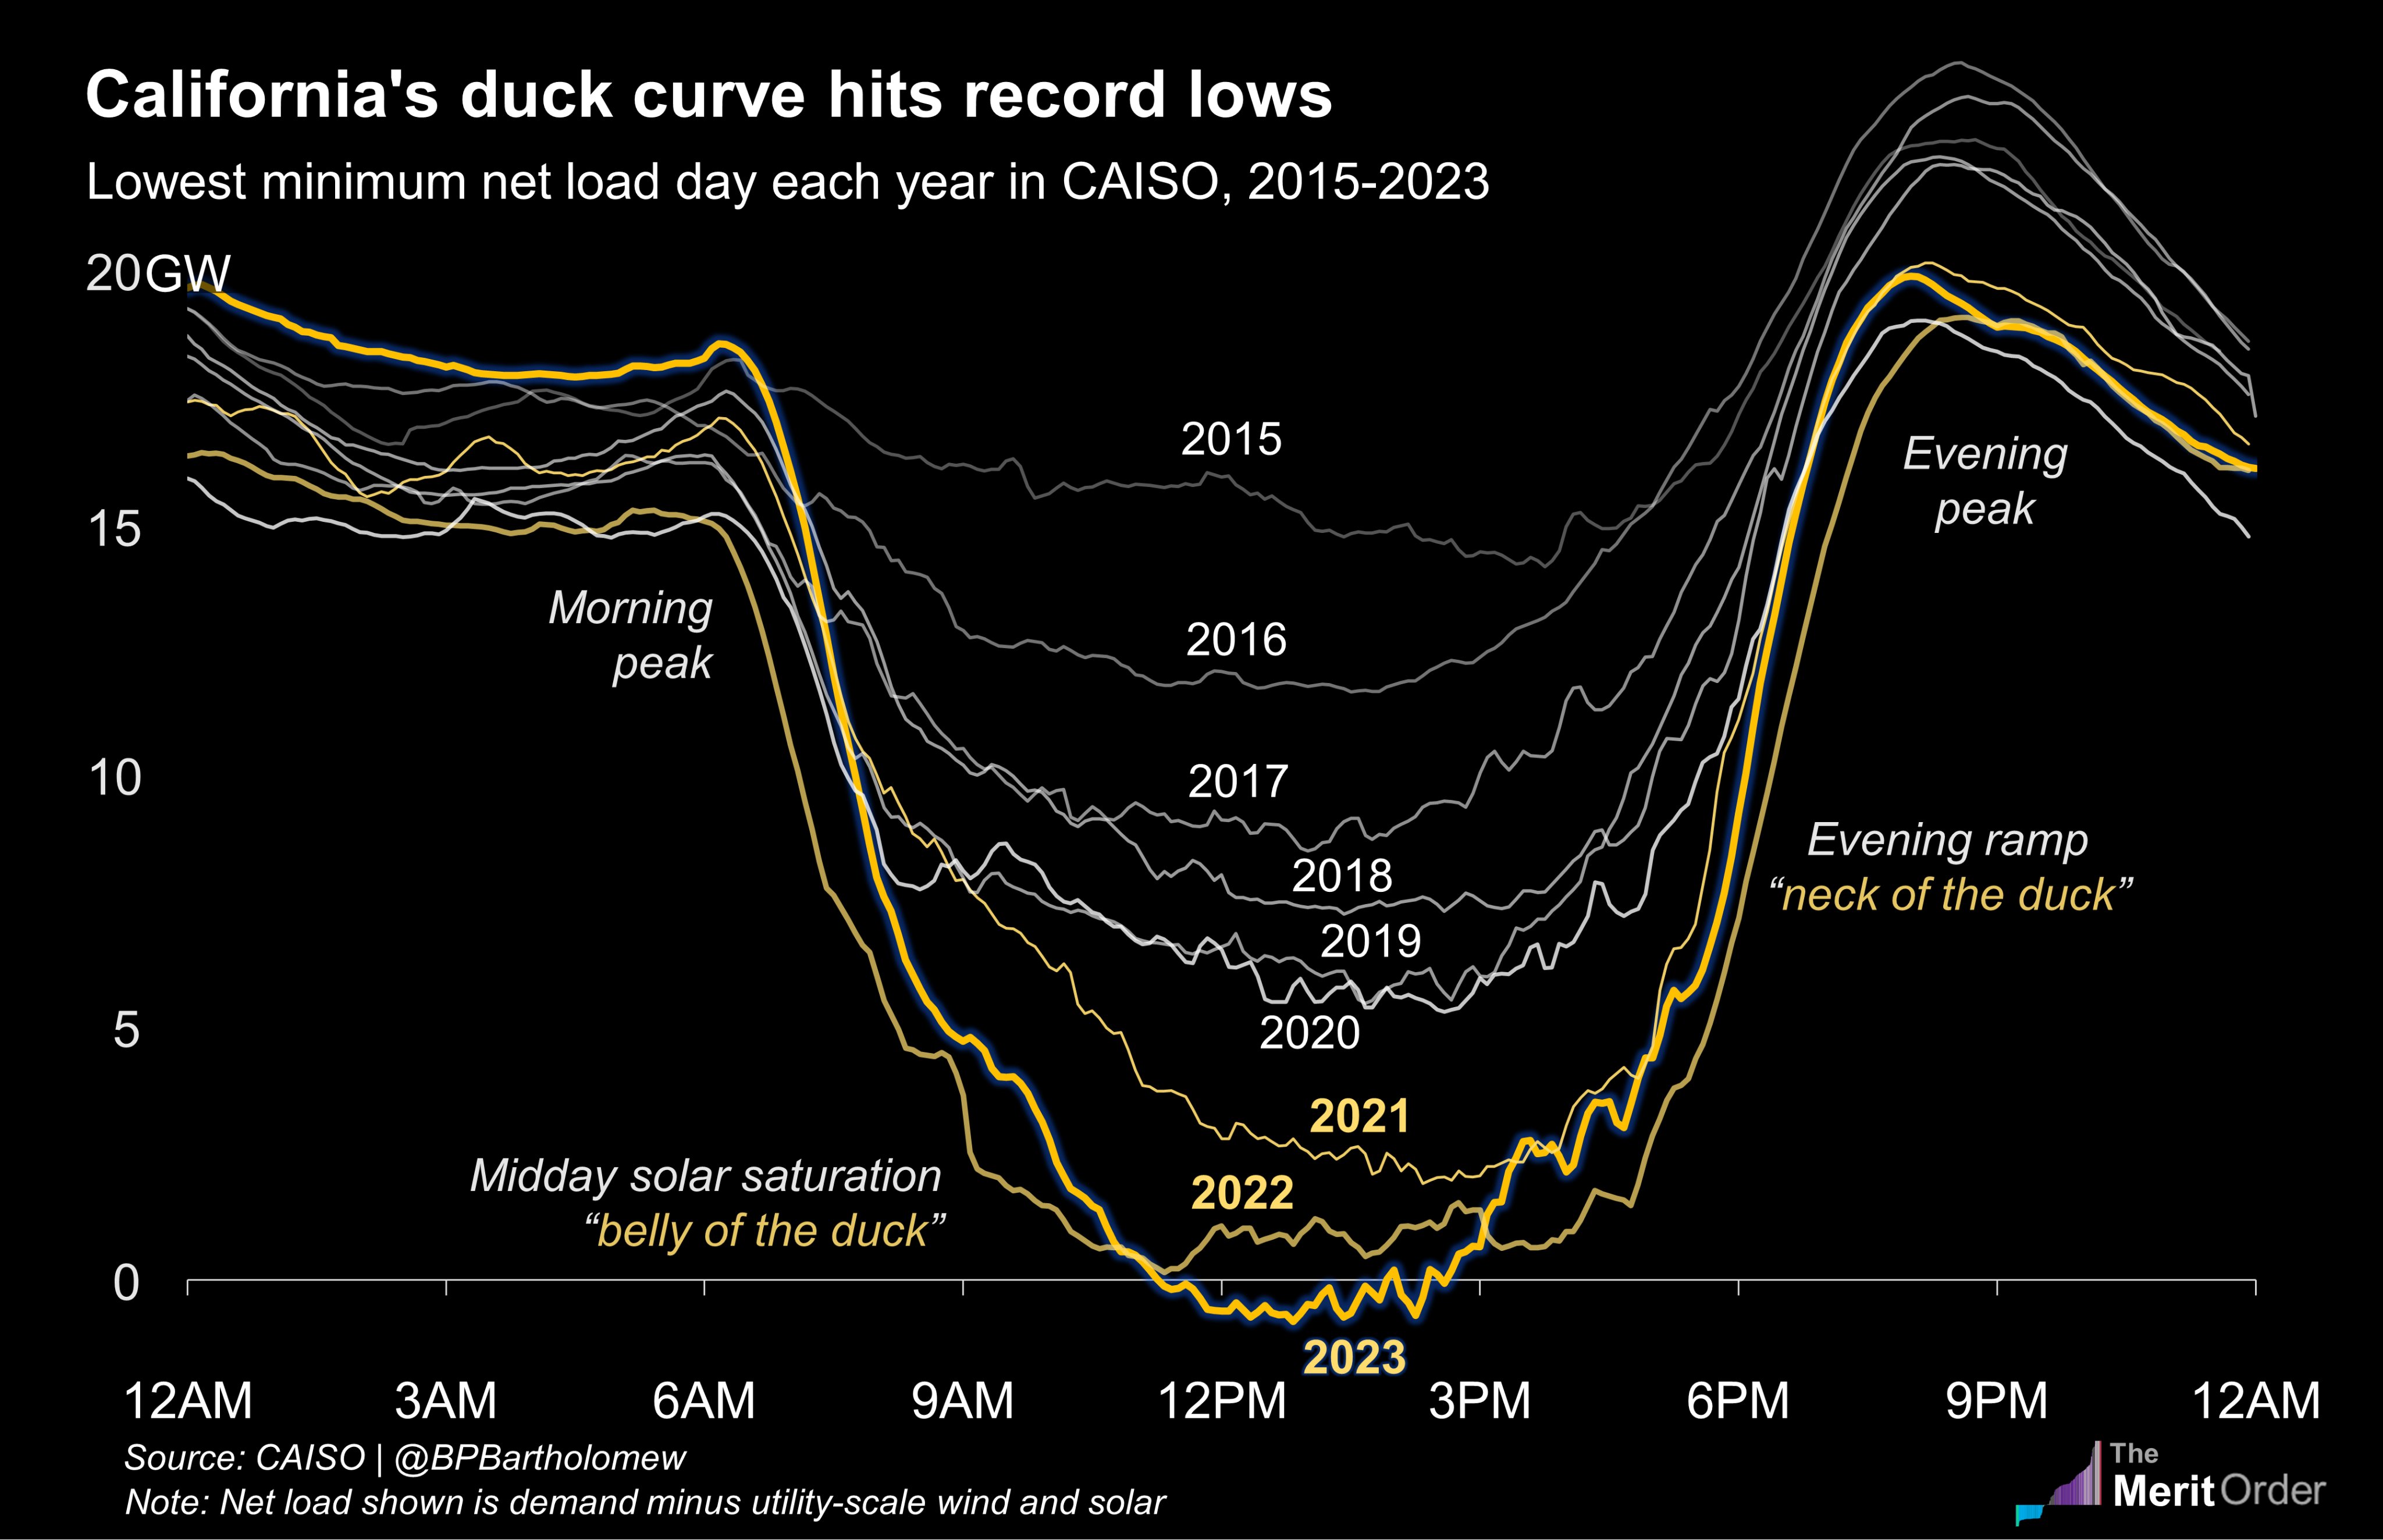
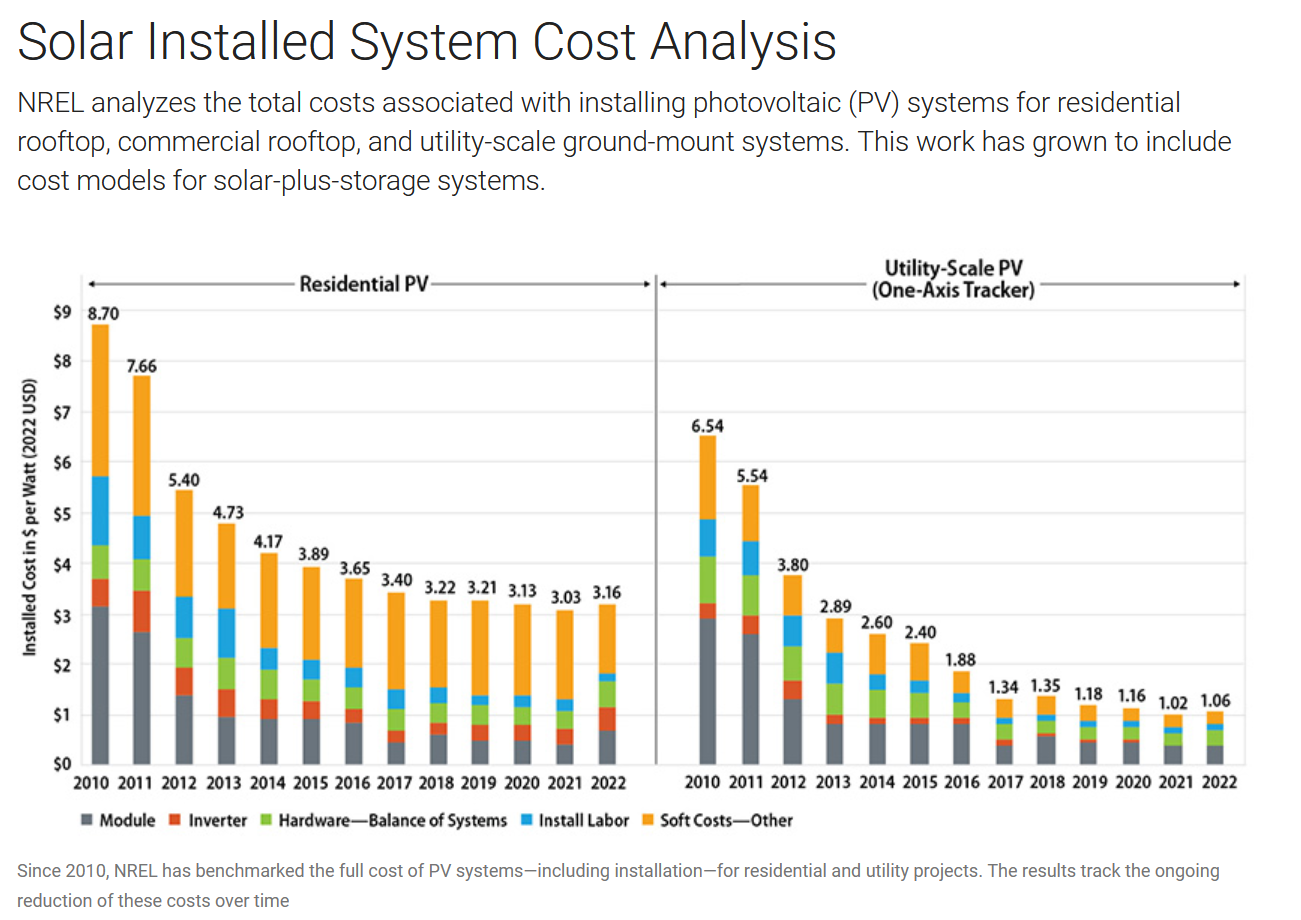
] --- <style> ref_test{ margin-left: 60px; margin-right: 40px; margin-top: -10px; font-size: 16px; } hr.space-1 { background: transparent; color: transparent; margin: 0; height: 1rem; } br.test{ line-height: 150%; } </style> <style type="text/css"> .ref { margin-left: 60px; margin-right: 40px; margin-top: -10px; font-size: 16px; } </style> <style type="text/css"> blockquote { border-left: .2px solid #275d38; margin: -5px 80px -5px 20px; padding-top: -0.5px; padding-bottom: -0.5px; line-height: 1.35em; } .cite { margin: -20px 80px -25px 80px; padding-top: -0.5px; padding-bottom: -0.5px; line-height: 1.25em; font-size: 20px; } .space blockquote { margin: -25px 50px -25px 50px; padding-top: -0.5px; padding-bottom: -0.5px; } .space blockquote p { line-height: 1em; } .site_link{ font-size: 16px; } </style> <!--[test link](weekly_jan_18.html#featured-chart)--> <style type="text/css"> hr.space-1 { background: transparent; color: transparent; margin: 0; height: 1rem; } hr.space { background: transparent; color: transparent; margin: 0; height: 1em; } blockquote { border-left: .5px solid #275d38; margin: 15px 80px -25px 20px; padding-top: -0.5px; padding-bottom: -0.5px; line-height: 1.35em; } .cite_quote { margin: -80px 80px 25px 100px; padding-top: -0.5px; padding-bottom: -0.5px; line-height: 1em; font-size: 20px; } .cite { margin: -20px 80px -25px 80px; padding-top: -0.5px; padding-bottom: -0.5px; line-height: 1.25em; font-size: 20px; } .space blockquote { margin: -25px 50px -25px 50px; padding-top: -0.5px; padding-bottom: -0.5px; } .space blockquote p { line-height: 1em; } .site_link { font-size: 16px; } .blockquote { margin: 2em 0px -1em 0px; } .hr.space-1 { background: transparent; color: transparent; margin: 0; height: 1rem; } ul { margin-top: 1 em; margin-bottom: 0em; padding-bottom: 0em; padding-top: 0em; <!-- background-color:blue; --> } ul li { <!-- background-color:yellow; --> margin-top: 0em; margin-bottom: 0em; padding-bottom: 0em; padding-top: 0em; } ul ul { margin-top: -1em; margin-bottom: 0em; padding-bottom: 0em; padding-top: 0em; <!-- background-color:red; --> } ul ul li { margin-top: 0em; margin-bottom: 0em; padding-bottom: 0em; padding-top: -10em; <!-- background-color:green; --> } </style> # Electricity Generation Basics - plant characteristics - plant costs - plant revenues - levelized cost of electricity (equiv. supply costs) - generation mix here and elsewhere in Canada (data assignment) - challenges of renewable integration - forward markets and hedging --- # Key plant characteristics - capacity: peak generation, in MW - capacity factor: average share of peak (%) - dispatch: can I turn it on or off? - seasonal constraints --- # Cost of New Generation - we tend to express the costs of new generation as the levelized cost of electricity (LCOE) - this is, like the supply cost for oil sands, a value that represents the electricity market revenue you need to earn to make a reasonable rate of return on capital and/or equity - you can think of it as an gross or a net measure, and I'll show you what I mean in both cases --- # Simplified LCOE You can simplify an LCOE using an annual amortization method (see [NREL](https://sam.nrel.gov/financial-models/lcoe-calculator.html)) to calculate a project's levelized cost of energy (LCOE), using the following inputs: Capital cost, $ (TCC) Fixed annual operating cost, $ (FOC) Variable operating cost, $/kWh (VOC) **Fixed charge rate (FCR)** Annual electricity production, kWh (AEP) NREL's LCOE calculator uses the following equation to calculate the LCOE: `$$LCOE = \frac{( FCR \times TCC + FOC )}{AEP} + VOC$$` The fixed charge rate, or FCR, is an annualized share of capital costs recovered each year, based on project financial parameters --- # True LCOE The LCOE is no different from a supply cost that we did for oil sands projects: Capital cost, $ (K) Fixed annual operating cost (FC) Variable operating cost (VC), $/MWh Discount rate (r), % Annual electricity production (Q), MWh `$$LCOE = \sum_{t=0}^T\frac{1}{1+r}\frac{(K_t+FC_t+VC_t \times Q_t )}{Q_t}$$` It's a production-weighted average of the net present value costs per unit of generation, generally calculated at a rate of return of 5-10% --- # LCOE vs supply cost The LCOE is no different from a supply cost that we did for oil sands projects: `$$LCOE = \sum_{t=0}^T\frac{1}{1+r}\frac{(K_t+FC_t+VC_t \times Q_t )}{Q_t}$$` Think of it this way: if prices are such that: `$$\sum_{t=0}^T\frac{1}{1+r} P_t = \sum_{t=0}^T\frac{1}{1+r}\frac{(K_t+FC_t+VC_t \times Q_t )}{Q_t}$$` The project makes it's *break even* rate of return on capital --- # True LCOE <img src="images/lcoe_model.png" width="1200px" style="display: block; margin: auto;" /> Excel model available [here](lcoe_calc.xlsx). --- # [Lazard LCOE](https://www.lazard.com/media/451905/lazards-levelized-cost-of-energy-version-150-vf.pdf) <embed src="lazard.pdf" width="1100px" height="610px" style="display: block; margin: auto;" type="application/pdf" /> --- # [EIA AEO LCOE](https://www.eia.gov/outlooks/aeo/pdf/electricity_generation.pdf) <img src="images/lcoe_eia.png" width="900px" style="display: block; margin: auto;" /> --- # [EIA AEO LCOE](https://www.eia.gov/outlooks/aeo/pdf/electricity_generation.pdf) <embed src="eia_lcoe.pdf" width="1100px" height="610px" style="display: block; margin: auto;" type="application/pdf" /> --- # [NREL Solar LCOE](https://www.nrel.gov/docs/fy23osti/87303.pdf) <img src="images/solar_costs_1.png" width="900px" style="display: block; margin: auto;" /> --- # [NREL Solar LCOE Report](https://www.nrel.gov/docs/fy23osti/87303.pdf) <embed src="nrel_lcoe.pdf" width="900px" height="610px" style="display: block; margin: auto;" type="application/pdf" /> --- # What determines LCOE - capital cost - capacity factor - operating costs - taxes and subsidies incl. carbon prices - fuel costs - transmission costs (in some locations, not Alberta) - debt and equity costs (WACC) - non-electricity revenue (e.g. RECs or offsets) --- # What about revenue? - dispatchable plants can avoid low cost periods and take advantage of high cost periods - storage assets can arbitrage high and low prices - some non-dispatchable assets may generate at peak price periods (e.g. solar) - renewable generation tends to be correlated and thus associated with lower prices - renewable generation can erode value of *base-load* plants --- # CAISO Daily Patterns of Prices and Loads <img src="images/cali_market.jpg" width="1100px" style="display: block; margin: auto;" /> --- # Dispatch and correlation lead to different average revenues <img src="images/price_capture.png" width="1200px" style="display: block; margin: auto;" /> --- # Dispatch and correlation lead to different average revenues <img src="images/price_capture_zoom.png" width="1200px" style="display: block; margin: auto;" /> --- # The *duck* curve <img src="images/duck.jpg" width="850px" style="display: block; margin: auto;" /> --- # Carbon tax costs matter <img src="images/cost_ctax.png" width="1200px" style="display: block; margin: auto;" /> --- # But, so does the value of *output-based allocations* <img src="images/oba_value.png" width="1200px" style="display: block; margin: auto;" /> --- # Combined impacts on revenues <img src="images/price_capture_ctax.png" width="1200px" style="display: block; margin: auto;" /> --- # Dispatch and correlation lead to different average revenues <img src="images/price_capture.png" width="1200px" style="display: block; margin: auto;" /> --- # [Market Power And Economic Withholding](https://www.albertamsa.ca/assets/Documents/Q4-2022-Presentation.pdf) - Lerner index (% markup of price over marginal cost) - Market concentration metrics (3-firm, 4-firm concentration ratios, Herfindahl Hirschman Index (HHI)) - `$$HHI=\sum_{i=1}^n S_i^2$$`, where `$$S_i$$` is the market share of each firm i in the market - Is economic withholding a bad thing? --- # [Market Power And Economic Withholding](https://www.albertamsa.ca/assets/Documents/Q4-2022-Presentation.pdf) <hr.space-1> <embed src="msa.pdf" width="1000px" height="580px" style="display: block; margin: auto;" type="application/pdf" />